- Home >
- Stock Photos >
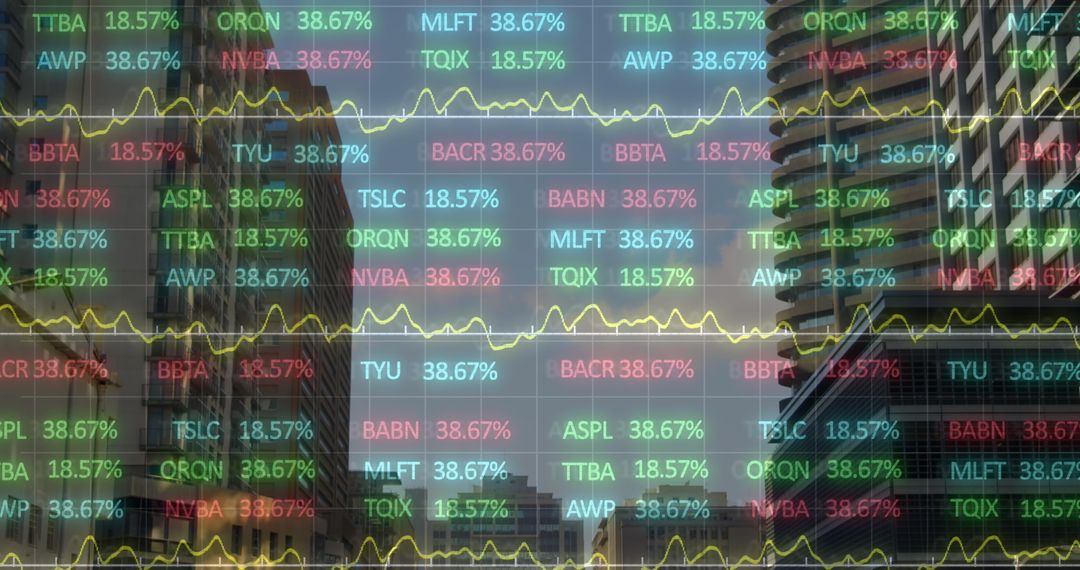
- Dynamic Visualization of Stock Market Data on Blue Background
Dynamic Visualization of Stock Market Data on Blue Background Image

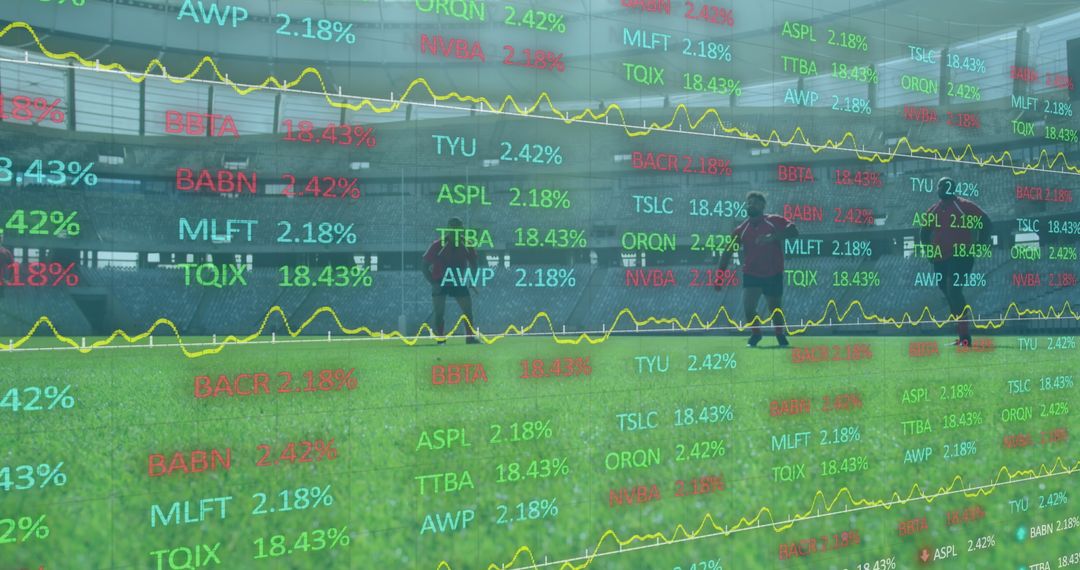
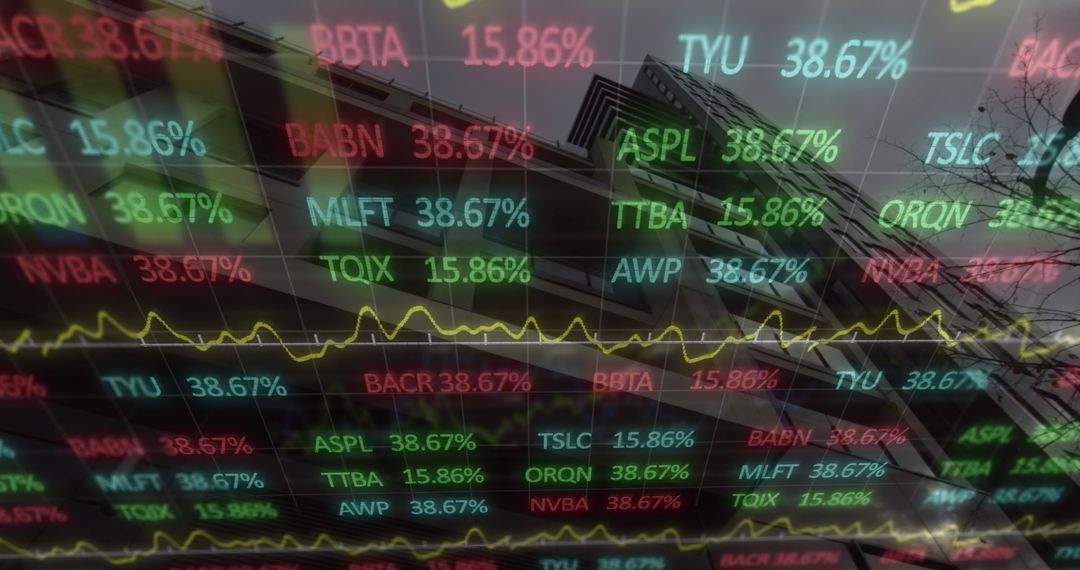
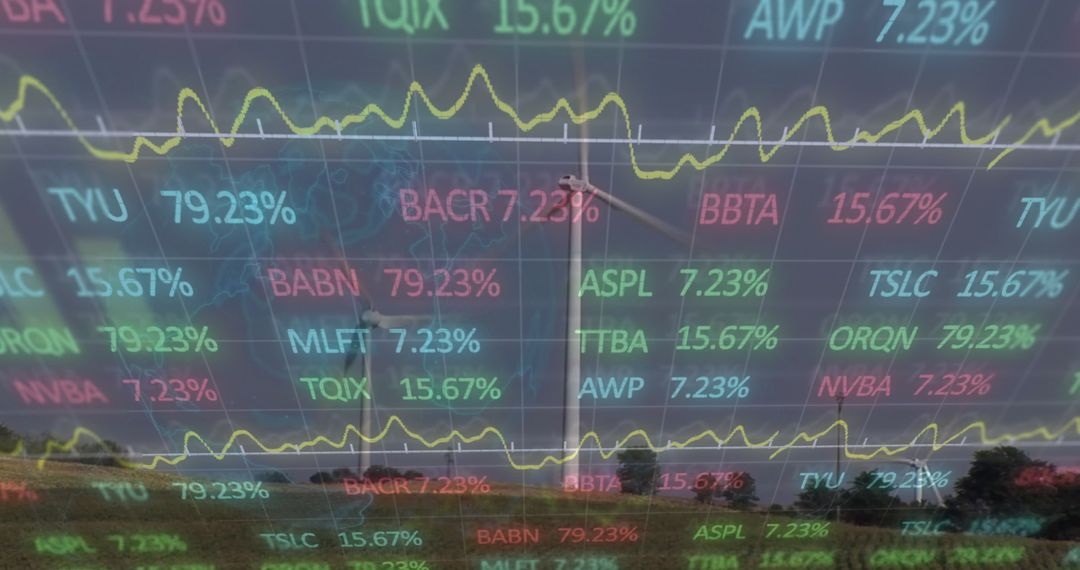
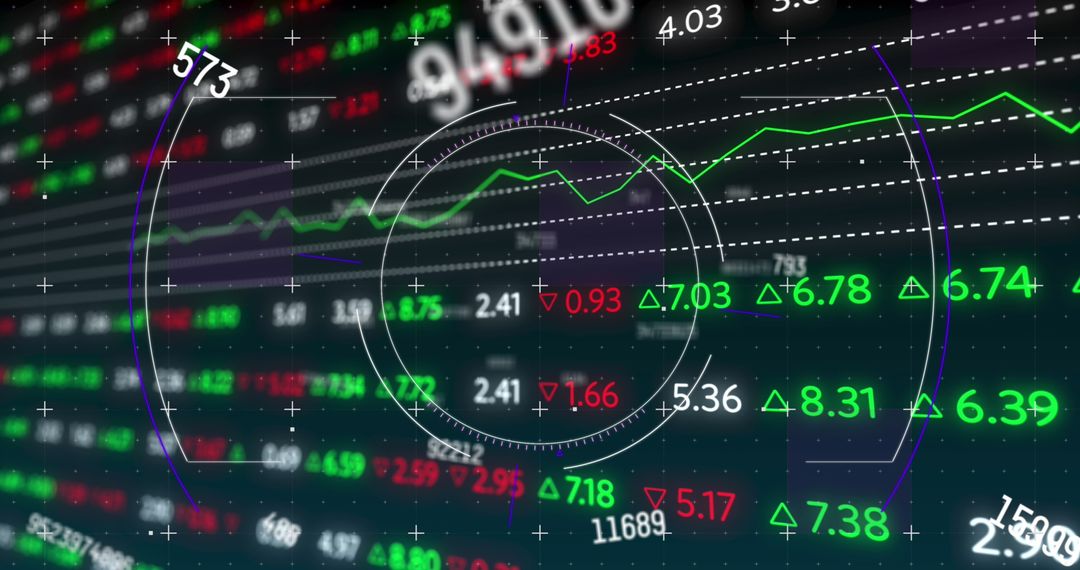
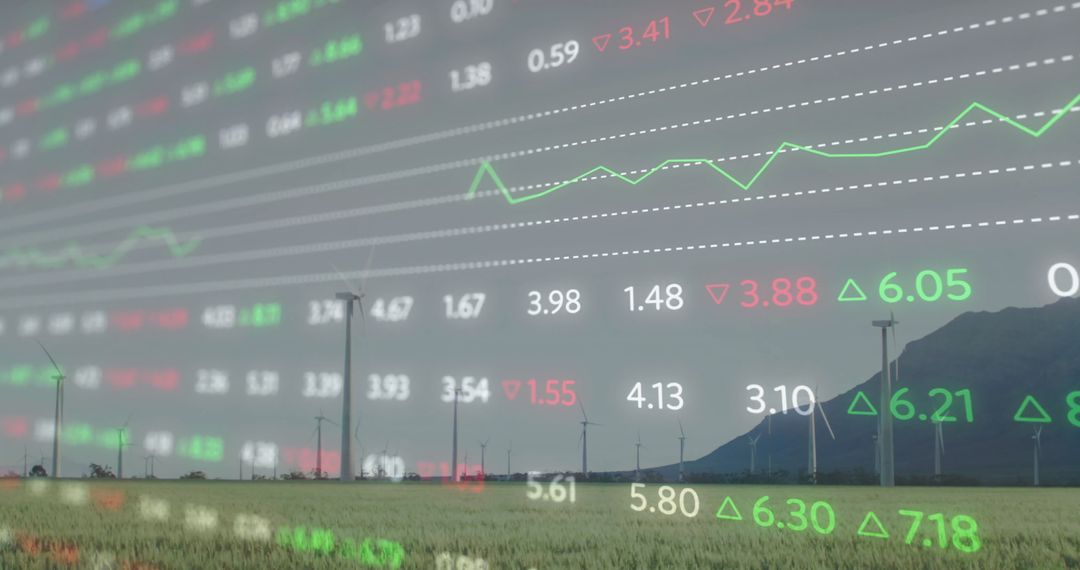
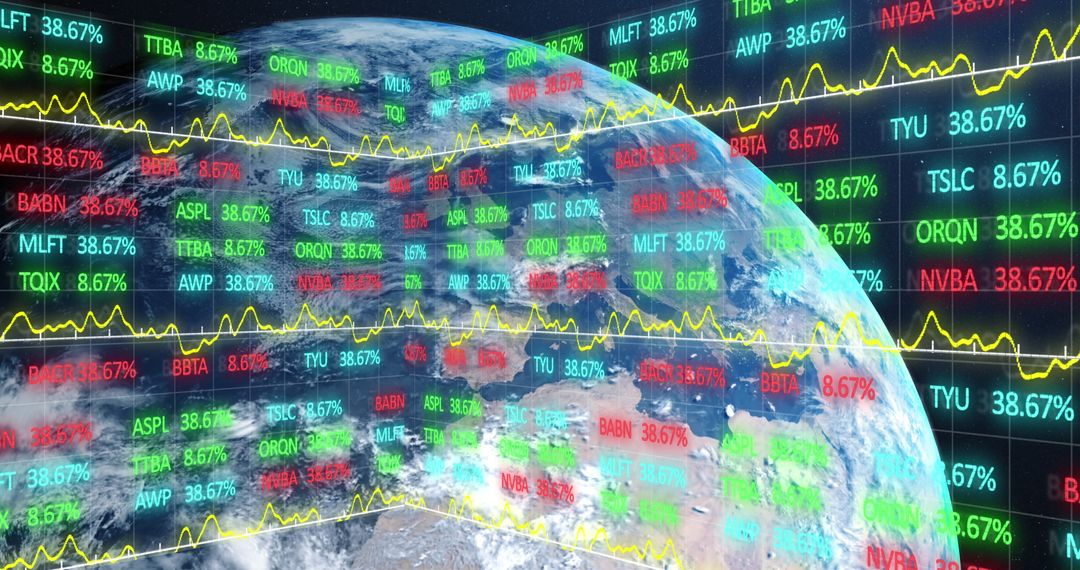
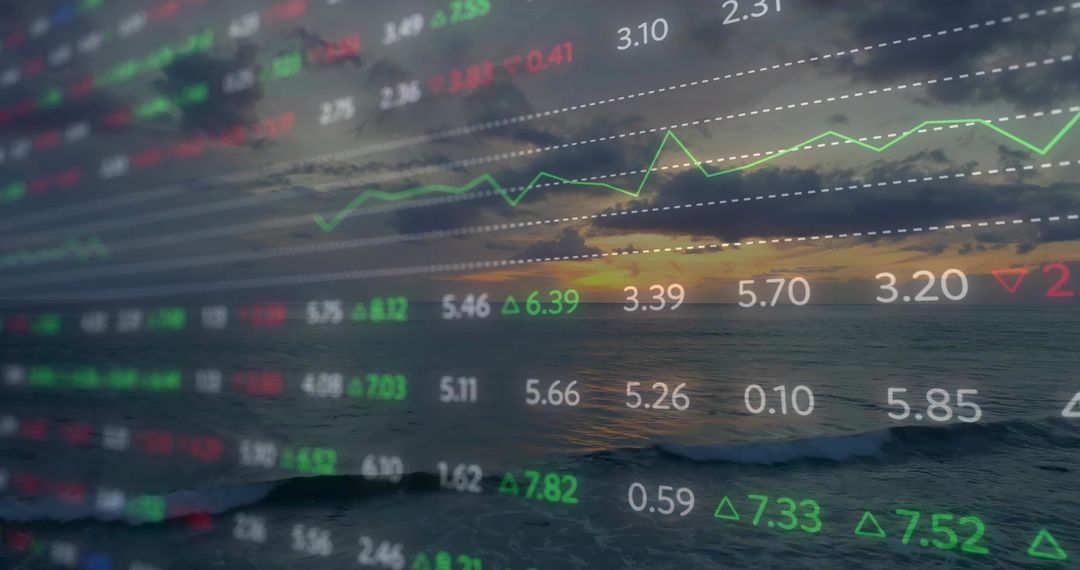
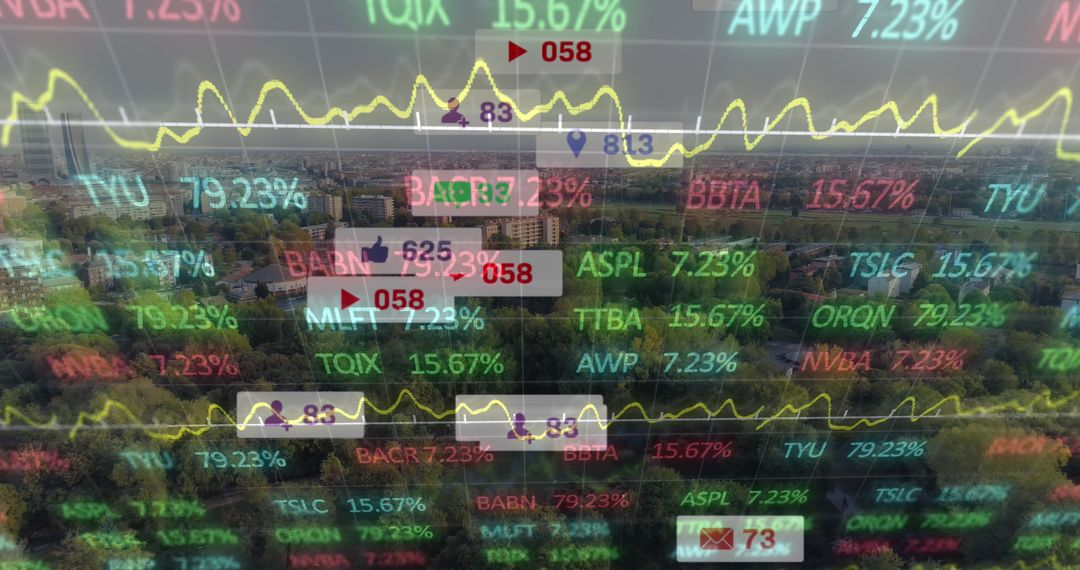
Visual representation of stock market data with a blue background. Displays fluctuating stock prices with red and green numbers indicating changes in the market. Useful for financial reports, investment guides, economic analysis presentations, or technology-related articles. Conceptual image representing trends and movements in the market. Suitable for use in illustrating topics related to trading, investment strategies, and market forecasting.
Powered by  - Get 15% off with code: PIKWIZARD15


2
downloads
downloads
Tags:
More
Credit Photo
If you would like to credit the Photo, here are some ways you can do so
Text Link
photo Link
<span class="text-link">
<span>
<a target="_blank" href=https://pikwizard.com/photo/dynamic-visualization-of-stock-market-data-on-blue-background/d9ec3a50bcfc02bb707fb8a5e1290385/>PikWizard</a>
</span>
</span>
<span class="image-link">
<span
style="margin: 0 0 20px 0; display: inline-block; vertical-align: middle; width: 100%;"
>
<a
target="_blank"
href="https://pikwizard.com/photo/dynamic-visualization-of-stock-market-data-on-blue-background/d9ec3a50bcfc02bb707fb8a5e1290385/"
style="text-decoration: none; font-size: 10px; margin: 0;"
>
<img src="https://pikwizard.com/pw/medium/d9ec3a50bcfc02bb707fb8a5e1290385.jpg" style="margin: 0; width: 100%;" alt="" />
<p style="font-size: 12px; margin: 0;">PikWizard</p>
</a>
</span>
</span>
Free (free of charge)
Free for personal and commercial use.
Author: Creative Art
Similar Free Stock Images

Premium


Premium


Premium


Premium


Premium


Premium


Premium


Premium


Premium


Premium


Premium


Premium


Premium


Premium


Premium


Premium


Premium


Premium


Premium


Premium


Premium


Premium


Premium


Premium