- Home >
- Stock Photos >
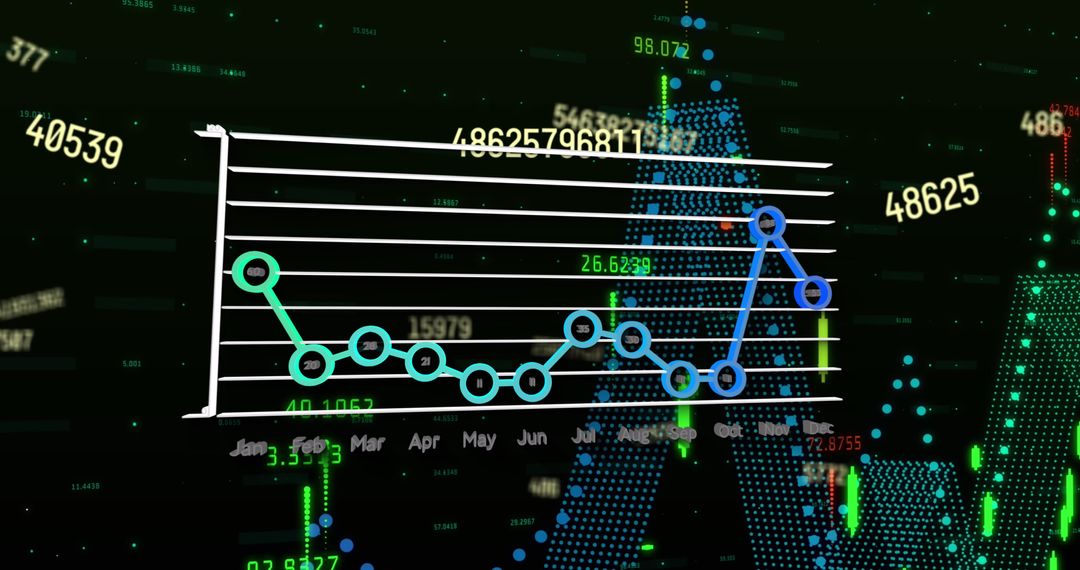
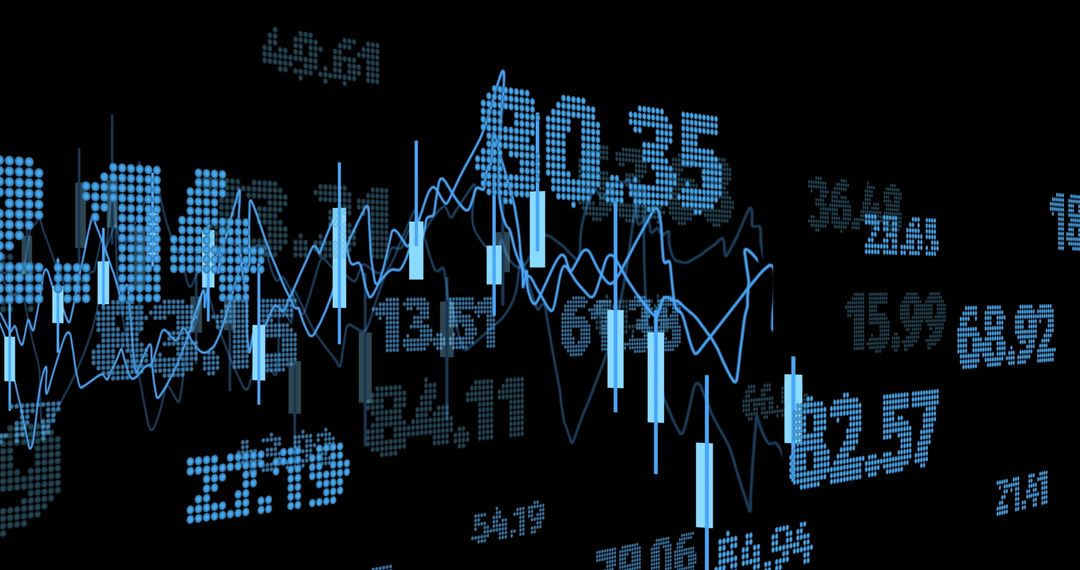
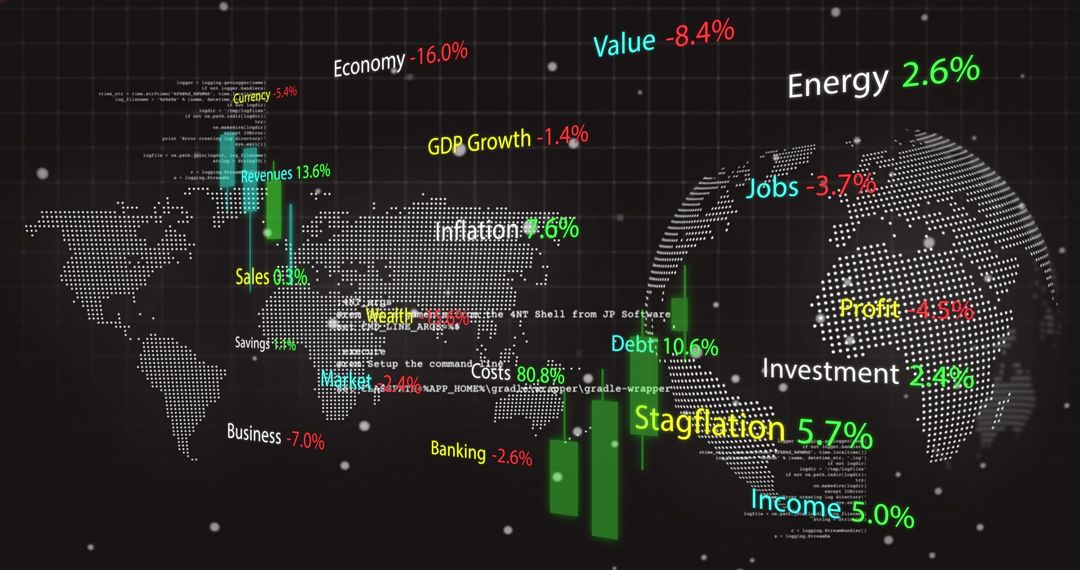
- Dynamic Visuals of Financial Data with Growth Indicators
Dynamic Visuals of Financial Data with Growth Indicators Image

This image visually represents the dynamic world of financial data processing, showcasing various economic indicators like inflation, savings, and currency displayed across a digital interface. Ideal for use in articles, presentations, and websites focused on finance, economics, market analysis, and investment.
Powered by 


3
downloads
downloads
Tags:
More
Credit Photo
If you would like to credit the Photo, here are some ways you can do so
Text Link
photo Link
<span class="text-link">
<span>
<a target="_blank" href=https://pikwizard.com/photo/dynamic-visuals-of-financial-data-with-growth-indicators/f3d3440bf6cb9e4ae36527827e2319c9/>PikWizard</a>
</span>
</span>
<span class="image-link">
<span
style="margin: 0 0 20px 0; display: inline-block; vertical-align: middle; width: 100%;"
>
<a
target="_blank"
href="https://pikwizard.com/photo/dynamic-visuals-of-financial-data-with-growth-indicators/f3d3440bf6cb9e4ae36527827e2319c9/"
style="text-decoration: none; font-size: 10px; margin: 0;"
>
<img src="https://pikwizard.com/pw/medium/f3d3440bf6cb9e4ae36527827e2319c9.jpg" style="margin: 0; width: 100%;" alt="" />
<p style="font-size: 12px; margin: 0;">PikWizard</p>
</a>
</span>
</span>
Free (free of charge)
Free for personal and commercial use.
Author: People Creations
Similar Free Stock Images

Premium


Premium


Premium


Premium


Premium


Premium


Premium


Premium


Premium


Premium


Premium


Premium


Premium


Premium


Premium


Premium


Premium


Premium


Premium


Premium


Premium


Premium


Premium


Premium