- Home >
- Stock Photos >
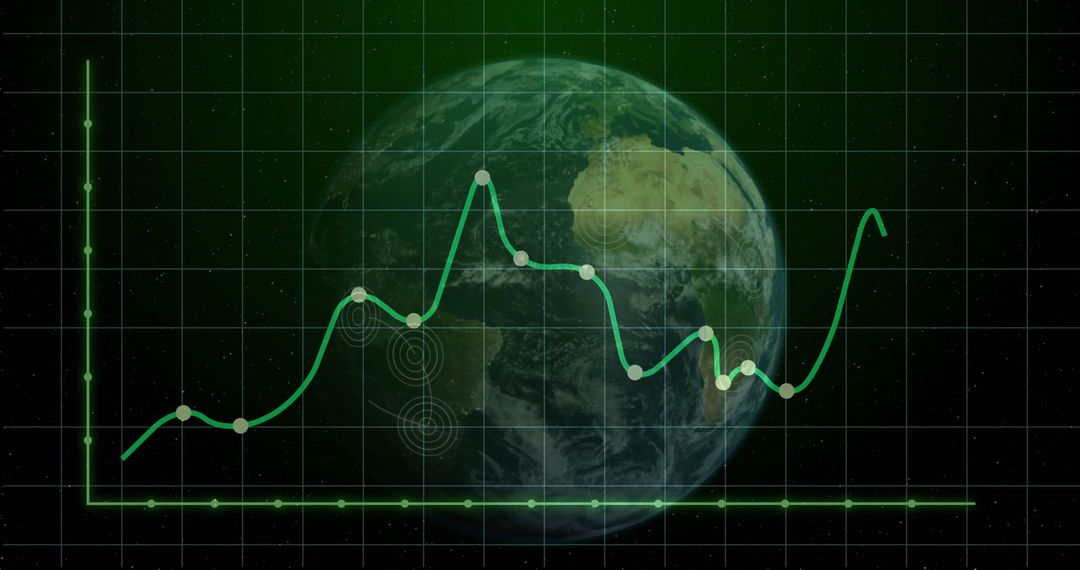
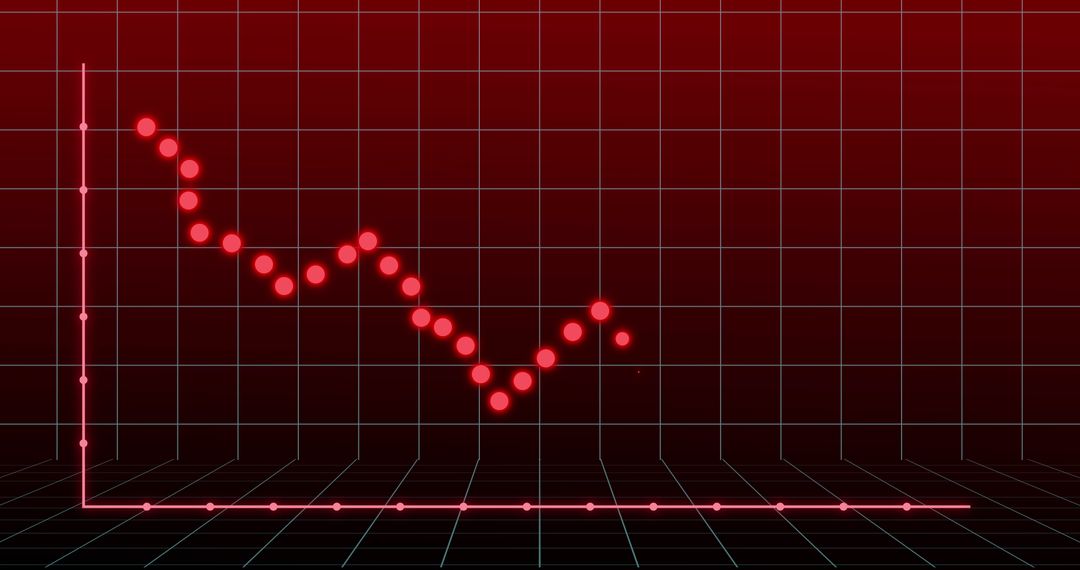
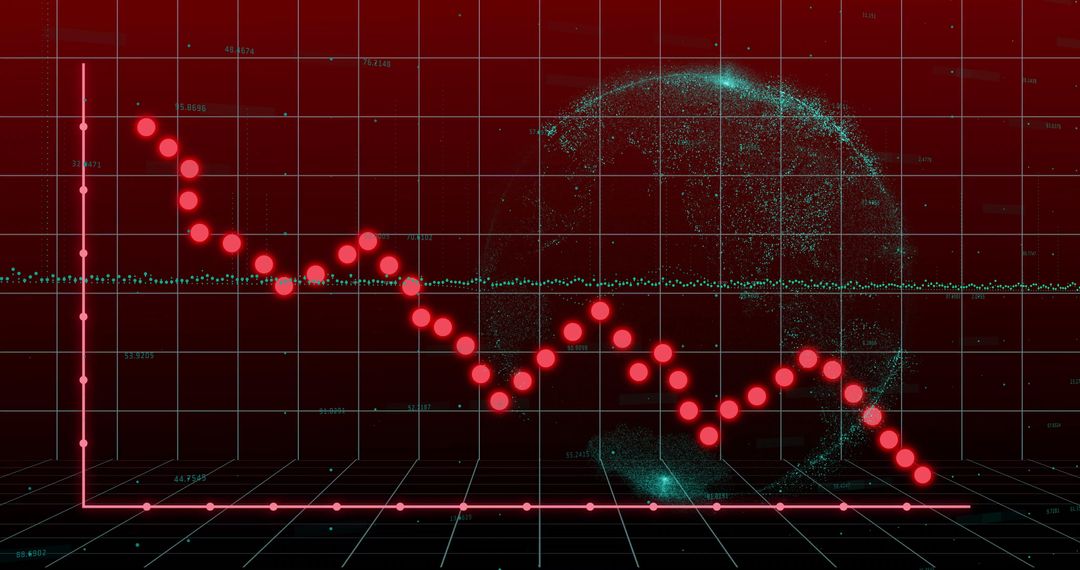
- Earth Surrounded by Digital Graph Displaying Declining Trend
Earth Surrounded by Digital Graph Displaying Declining Trend Image
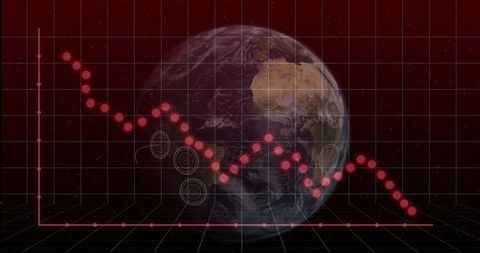
Displays Earth with an expansive red grid and a plunging line graph, suggesting global data analytics and technological implications. Useful for presentations on economic forecasts, climate change studies, or data trends impacting global markets. Ideal for educational or business materials highlighting data visualization in a futuristic context.
Powered by 


0
downloads
downloads
Tags:
More
Credit Photo
If you would like to credit the Photo, here are some ways you can do so
Text Link
photo Link
<span class="text-link">
<span>
<a target="_blank" href=https://pikwizard.com/photo/earth-surrounded-by-digital-graph-displaying-declining-trend/2b7846150f5690b99b15b91eb1166c3d/>PikWizard</a>
</span>
</span>
<span class="image-link">
<span
style="margin: 0 0 20px 0; display: inline-block; vertical-align: middle; width: 100%;"
>
<a
target="_blank"
href="https://pikwizard.com/photo/earth-surrounded-by-digital-graph-displaying-declining-trend/2b7846150f5690b99b15b91eb1166c3d/"
style="text-decoration: none; font-size: 10px; margin: 0;"
>
<img src="https://pikwizard.com/pw/medium/2b7846150f5690b99b15b91eb1166c3d.jpg" style="margin: 0; width: 100%;" alt="" />
<p style="font-size: 12px; margin: 0;">PikWizard</p>
</a>
</span>
</span>
Free (free of charge)
Free for personal and commercial use.
Author: People Creations
Similar Free Stock Images

Premium


Premium


Premium


Premium


Premium


Premium


Premium


Premium


Premium


Premium


Premium


Premium


Premium


Premium


Premium


Premium


Premium


Premium


Premium


Premium


Premium


Premium


Premium


Premium