- Home >
- Stock Photos >
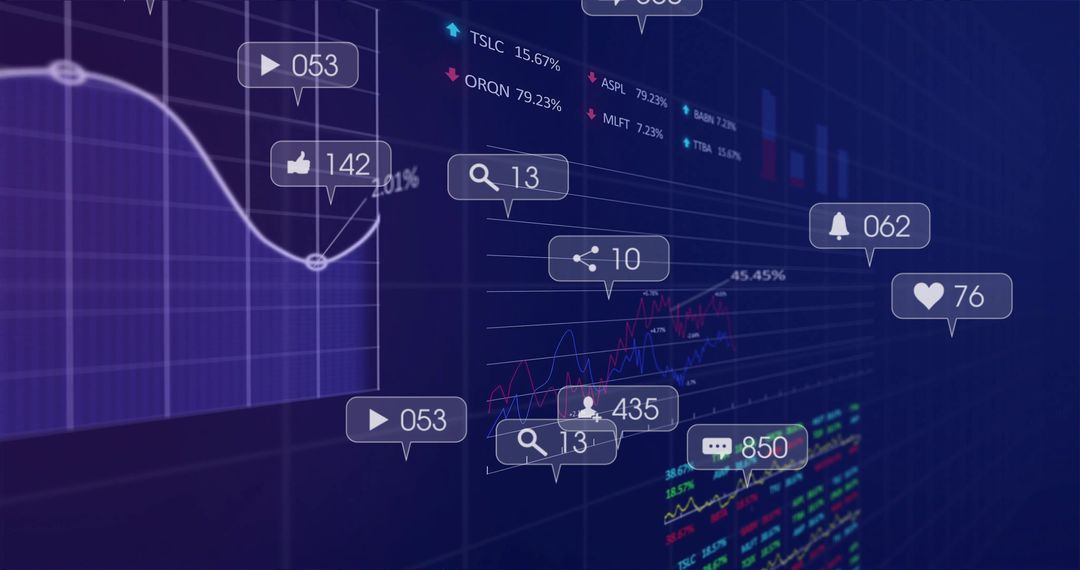
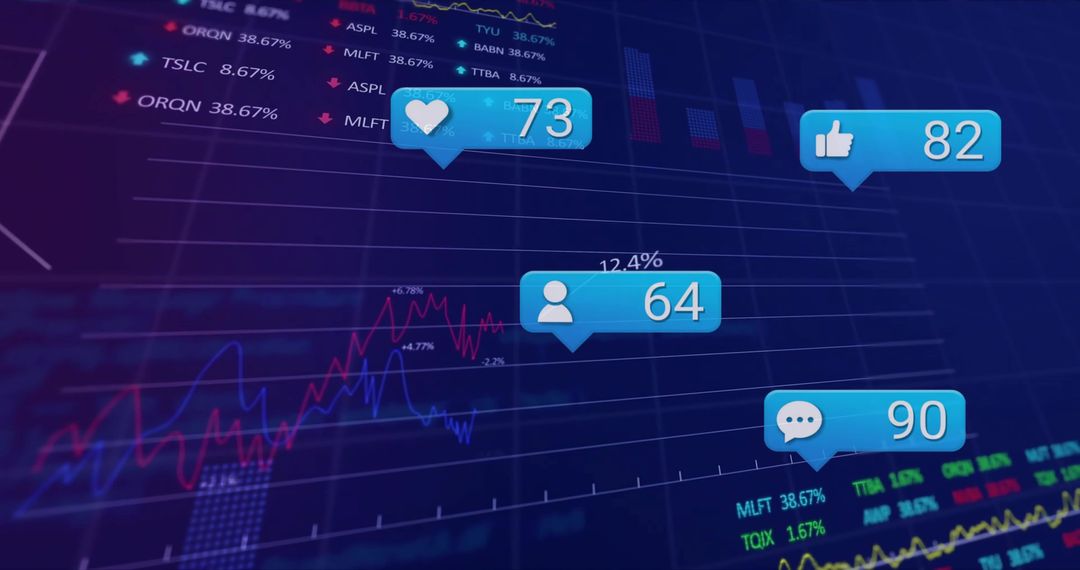
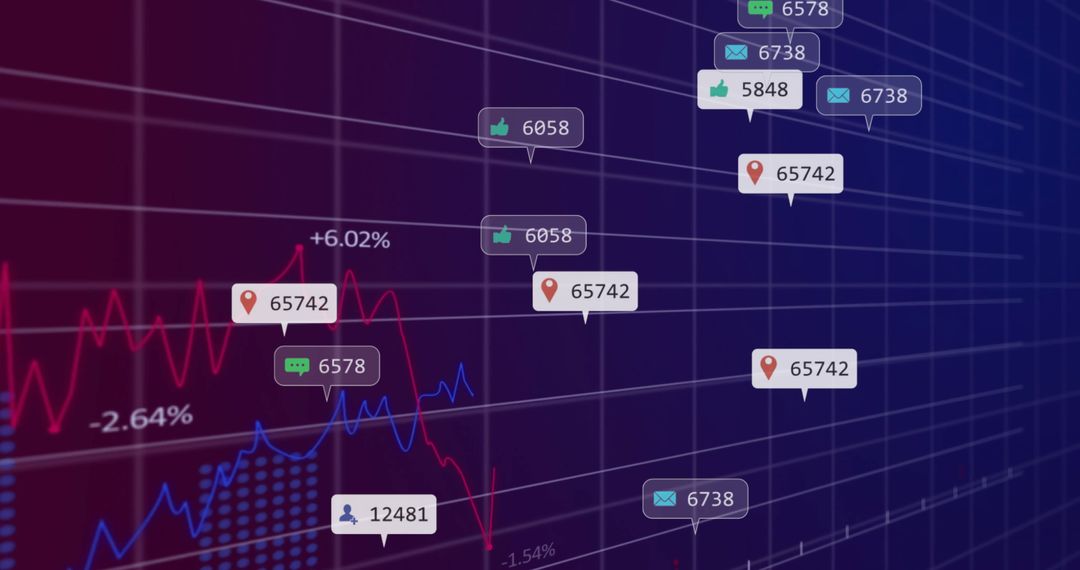
- Eco Analytics Dashboard with Finance and Sustainability Metrics
Eco Analytics Dashboard with Finance and Sustainability Metrics Image
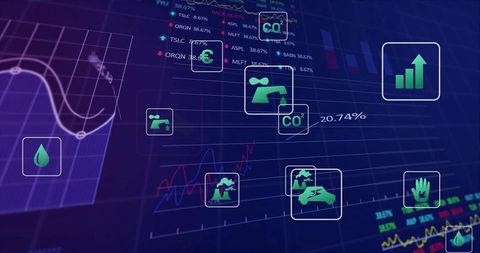
This conceptual image presents a futuristic dashboard integrating environmental metrics with financial data. Eco-friendly indicators and graphs illustrate the fusion of finance and sustainability. This is perfect for illustrating modern analysis, innovation in green business strategies, or tech-savvy environmental applications. Use it for promoting corporate sustainability or data-driven environmental projects.
Powered by 


0
downloads
downloads
Tags:
More
Credit Photo
If you would like to credit the Photo, here are some ways you can do so
Text Link
photo Link
<span class="text-link">
<span>
<a target="_blank" href=https://pikwizard.com/photo/eco-analytics-dashboard-with-finance-and-sustainability-metrics/78d01f815c60ff7160bad405598284f7/>PikWizard</a>
</span>
</span>
<span class="image-link">
<span
style="margin: 0 0 20px 0; display: inline-block; vertical-align: middle; width: 100%;"
>
<a
target="_blank"
href="https://pikwizard.com/photo/eco-analytics-dashboard-with-finance-and-sustainability-metrics/78d01f815c60ff7160bad405598284f7/"
style="text-decoration: none; font-size: 10px; margin: 0;"
>
<img src="https://pikwizard.com/pw/medium/78d01f815c60ff7160bad405598284f7.jpg" style="margin: 0; width: 100%;" alt="" />
<p style="font-size: 12px; margin: 0;">PikWizard</p>
</a>
</span>
</span>
Free (free of charge)
Free for personal and commercial use.
Author: People Creations
Similar Free Stock Images

Premium


Premium


Premium


Premium


Premium


Premium


Premium


Premium


Premium


Premium


Premium


Premium


Premium


Premium


Premium


Premium


Premium


Premium


Premium


Premium


Premium


Premium


Premium


Premium