
- Home >
- Stock Photos >
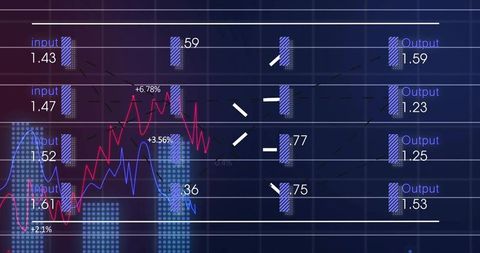
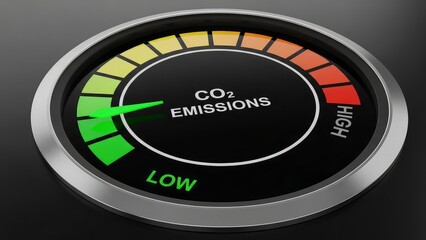
- Eco Data Visualization with Environmental Icons and Graphs
Eco Data Visualization with Environmental Icons and Graphs Image

Visual representation of eco-related data featuring graphs and environmental icons such as CO2 emissions and renewable energy. Visuals suggest integration of analytics with environmental monitoring and sustainability efforts. This can be used in presentations, educational content, or campaigns promoting ecological awareness and technological solutions for climate change.
Powered by 


downloads
Tags:
More
Credit Photo
If you would like to credit the Photo, here are some ways you can do so
Text Link
photo Link
<span class="text-link">
<span>
<a target="_blank" href=https://pikwizard.com/photo/eco-data-visualization-with-environmental-icons-and-graphs/05ed11d005f2a5c8f32a33193a2c1139/>PikWizard</a>
</span>
</span>
<span class="image-link">
<span
style="margin: 0 0 20px 0; display: inline-block; vertical-align: middle; width: 100%;"
>
<a
target="_blank"
href="https://pikwizard.com/photo/eco-data-visualization-with-environmental-icons-and-graphs/05ed11d005f2a5c8f32a33193a2c1139/"
style="text-decoration: none; font-size: 10px; margin: 0;"
>
<img src="https://pikwizard.com/pw/medium/05ed11d005f2a5c8f32a33193a2c1139.jpg" style="margin: 0; width: 100%;" alt="" />
<p style="font-size: 12px; margin: 0;">PikWizard</p>
</a>
</span>
</span>
Free (free of charge)
Free for personal and commercial use.
Author: Authentic Images
Similar Free Stock Images

Premium


Premium


Premium


Premium

Premium


Premium


Premium


Premium


Premium


Premium

Premium

Premium


Premium

Premium


Premium

Premium

Premium


Premium


Premium


Premium


Premium


Premium


Premium


Premium


Premium

Explore More Free Stock Images