- Home >
- Stock Photos >
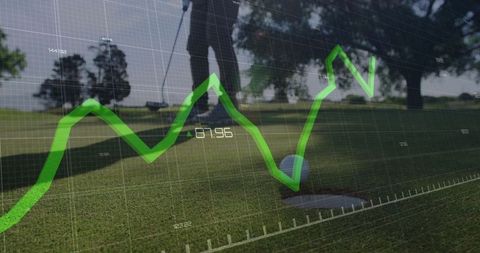
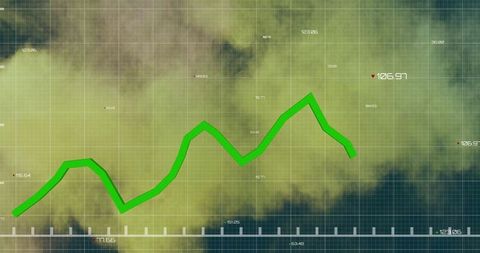
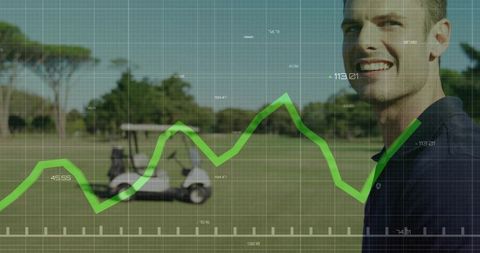
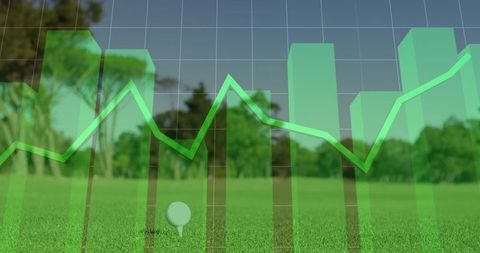
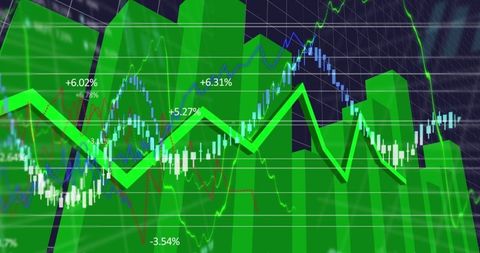
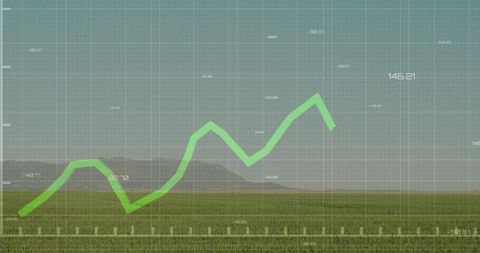
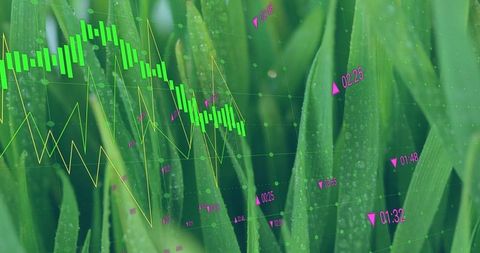
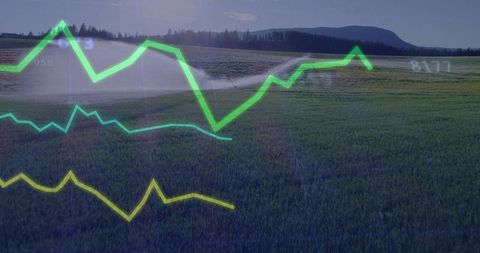
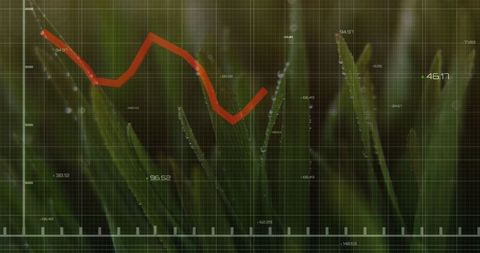
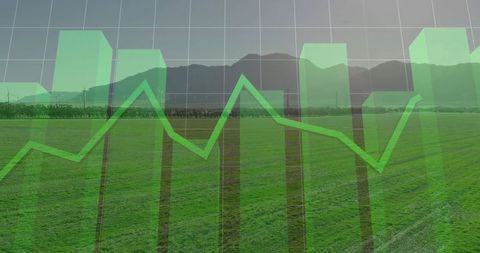
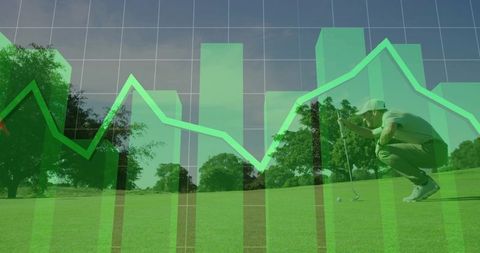
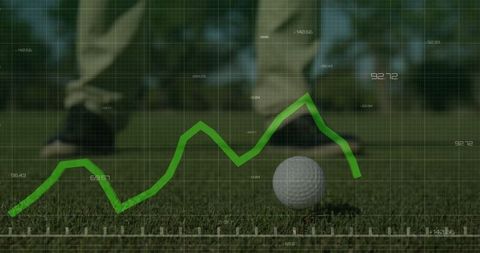
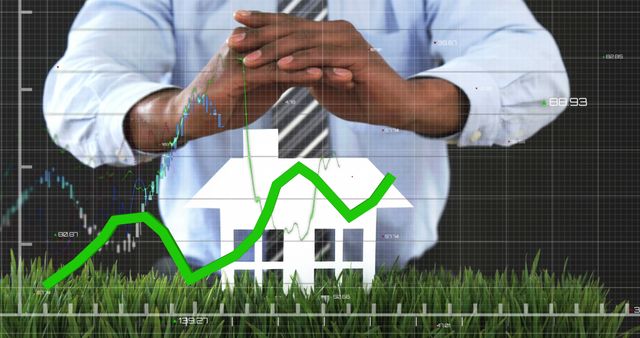
- Eco-Friendly Data Analysis with Green Line Graph over Grass
Eco-Friendly Data Analysis with Green Line Graph over Grass Image
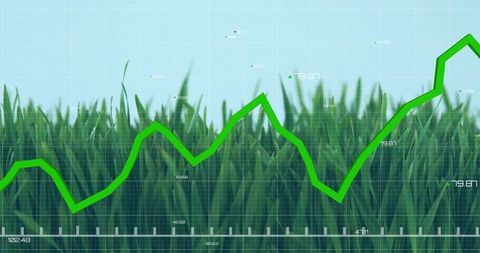
This visual represents merging technology with nature, where a prominent green line graph is set against a backdrop of grass, symbolizing eco-friendly data analysis. It evokes concepts such as sustainable growth, innovation, and eco-conscious technology, making it suitable for websites or presentations focused on environmental statistics, green technology products, or sustainability reports.

downloads
Tags:
More
Credit Photo
If you would like to credit the Photo, here are some ways you can do so
Text Link
photo Link
<span class="text-link">
<span>
<a target="_blank" href=https://pikwizard.com/photo/eco-friendly-data-analysis-with-green-line-graph-over-grass/6db00bd63a33af84097d552a2cd8386a/>PikWizard</a>
</span>
</span>
<span class="image-link">
<span
style="margin: 0 0 20px 0; display: inline-block; vertical-align: middle; width: 100%;"
>
<a
target="_blank"
href="https://pikwizard.com/photo/eco-friendly-data-analysis-with-green-line-graph-over-grass/6db00bd63a33af84097d552a2cd8386a/"
style="text-decoration: none; font-size: 10px; margin: 0;"
>
<img src="https://pikwizard.com/pw/medium/6db00bd63a33af84097d552a2cd8386a.jpg" style="margin: 0; width: 100%;" alt="" />
<p style="font-size: 12px; margin: 0;">PikWizard</p>
</a>
</span>
</span>
Free (free of charge)
Free for personal and commercial use.
Author: People Creations