- Home >
- Stock Photos >
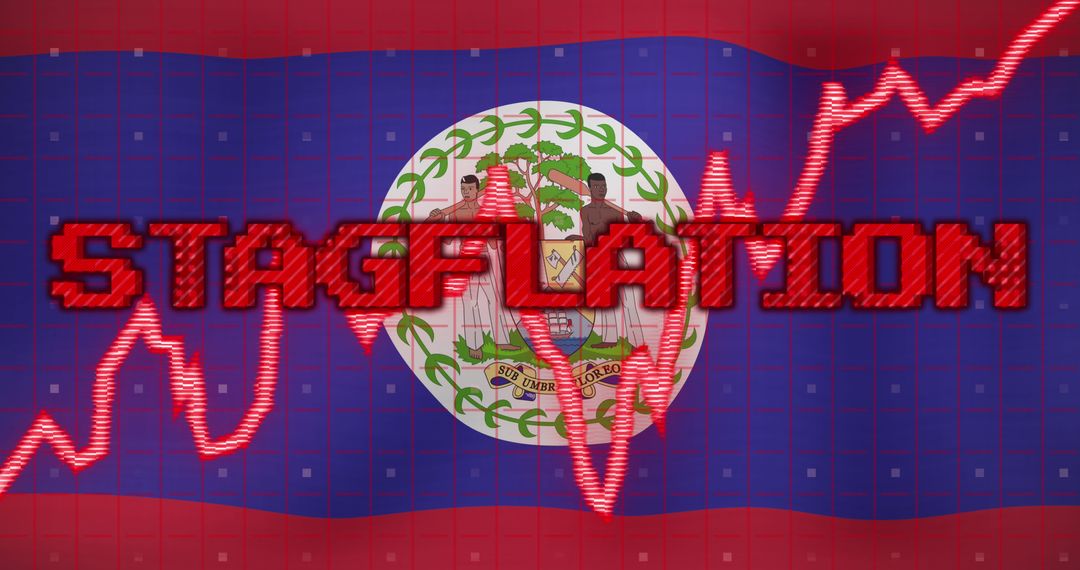
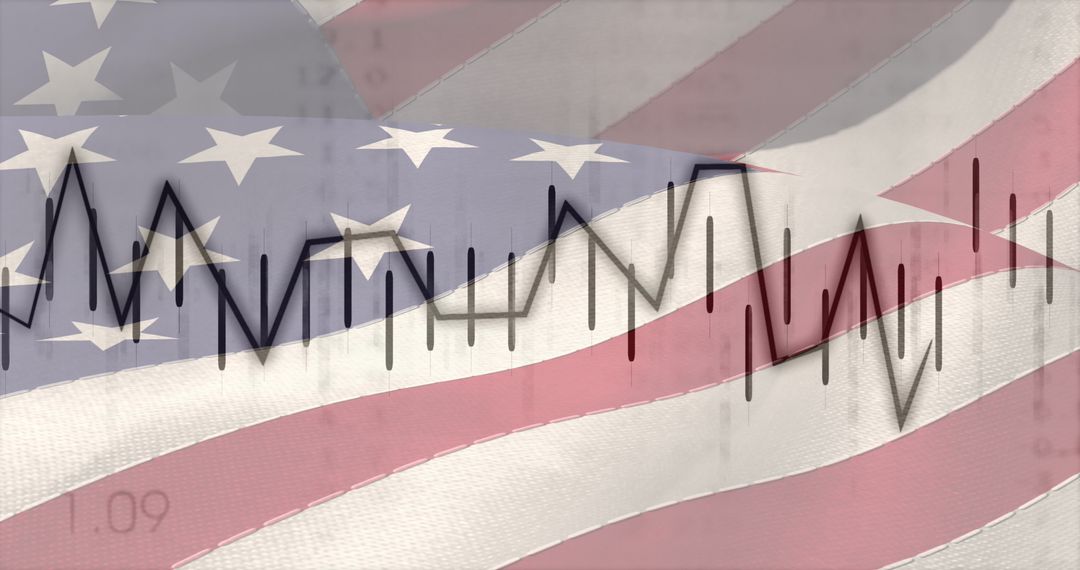
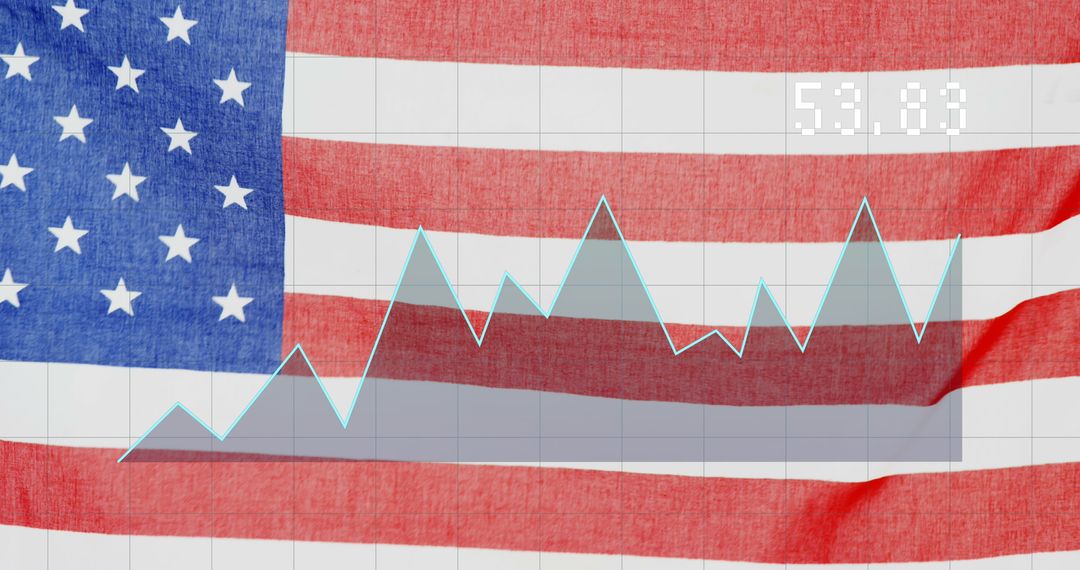
- Economic Concept of Stagflation with US Flag and Data Visualization
Economic Concept of Stagflation with US Flag and Data Visualization Image
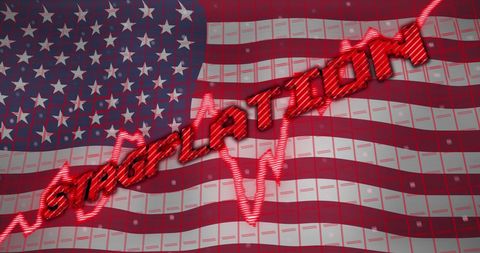
Red wave graph with 'stagflation' represents economic stagnation combined with inflation. Perfect for economic analysis, news articles about financial trends, or educational material on macroeconomics. Effective in exemplifying economic challenges in a global context.
Powered by 


2
downloads
downloads
Tags:
More
Credit Photo
If you would like to credit the Photo, here are some ways you can do so
Text Link
photo Link
<span class="text-link">
<span>
<a target="_blank" href=https://pikwizard.com/photo/economic-concept-of-stagflation-with-us-flag-and-data-visualization/0317e9a5eab1a362cbcec72e9ad17a46/>PikWizard</a>
</span>
</span>
<span class="image-link">
<span
style="margin: 0 0 20px 0; display: inline-block; vertical-align: middle; width: 100%;"
>
<a
target="_blank"
href="https://pikwizard.com/photo/economic-concept-of-stagflation-with-us-flag-and-data-visualization/0317e9a5eab1a362cbcec72e9ad17a46/"
style="text-decoration: none; font-size: 10px; margin: 0;"
>
<img src="https://pikwizard.com/pw/medium/0317e9a5eab1a362cbcec72e9ad17a46.jpg" style="margin: 0; width: 100%;" alt="" />
<p style="font-size: 12px; margin: 0;">PikWizard</p>
</a>
</span>
</span>
Free (free of charge)
Free for personal and commercial use.
Author: Awesome Content
Similar Free Stock Images

Premium


Premium


Premium


Premium


Premium


Premium


Premium


Premium


Premium


Premium


Premium


Premium


Premium


Premium


Premium


Premium


Premium


Premium


Premium


Premium


Premium


Premium


Premium


Premium