- Home >
- Stock Photos >
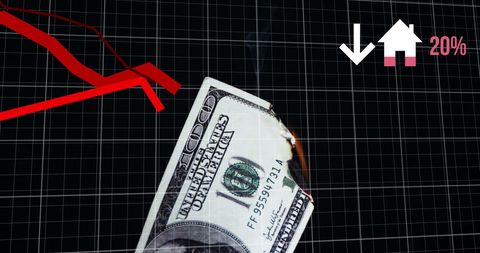
- Economic Crisis Depicted by Falling Graph and Burned Currency Concept
Economic Crisis Depicted by Falling Graph and Burned Currency Concept Image
Illustration captures an economic crisis with a dropping graph line, burned dollar, and housing market decline symbol. Perfect use for articles about financial instability, economic analysis, or investment risks. Ideal for educational materials, presentations, and reports highlighting the effects of economic fluctuations.

2
downloads
downloads
Tags:
More
Credit Photo
If you would like to credit the Photo, here are some ways you can do so
Text Link
photo Link
<span class="text-link">
<span>
<a target="_blank" href=https://pikwizard.com/photo/economic-crisis-depicted-by-falling-graph-and-burned-currency-concept/b464bdcbf37814d927122a23b36cf5a4/>PikWizard</a>
</span>
</span>
<span class="image-link">
<span
style="margin: 0 0 20px 0; display: inline-block; vertical-align: middle; width: 100%;"
>
<a
target="_blank"
href="https://pikwizard.com/photo/economic-crisis-depicted-by-falling-graph-and-burned-currency-concept/b464bdcbf37814d927122a23b36cf5a4/"
style="text-decoration: none; font-size: 10px; margin: 0;"
>
<img src="https://pikwizard.com/pw/medium/b464bdcbf37814d927122a23b36cf5a4.jpg" style="margin: 0; width: 100%;" alt="" />
<p style="font-size: 12px; margin: 0;">PikWizard</p>
</a>
</span>
</span>
Free (free of charge)
Free for personal and commercial use.
Author: Authentic Images
Similar Free Stock Images