- Home >
- Stock Photos >
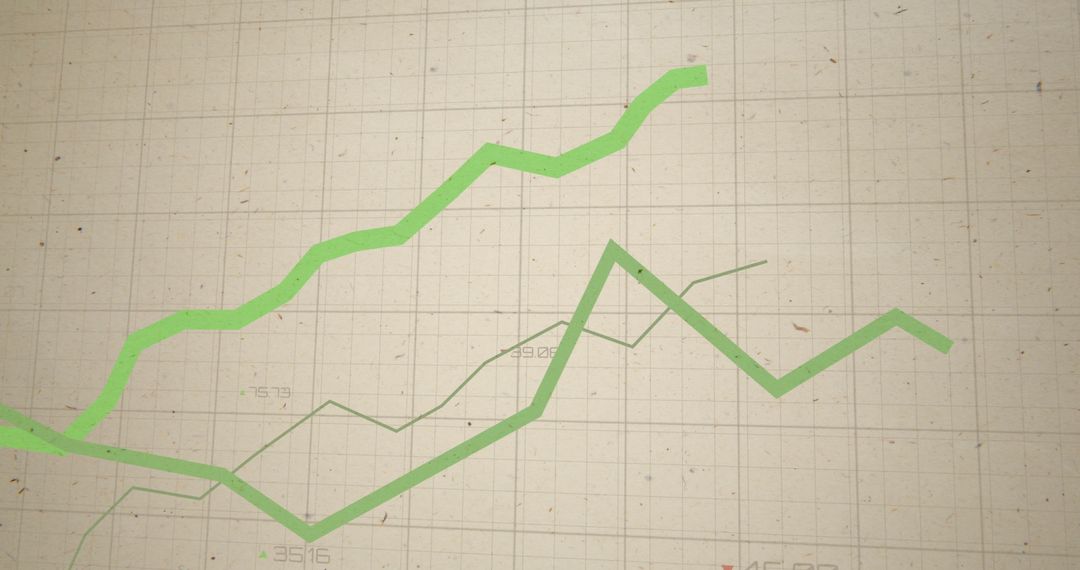
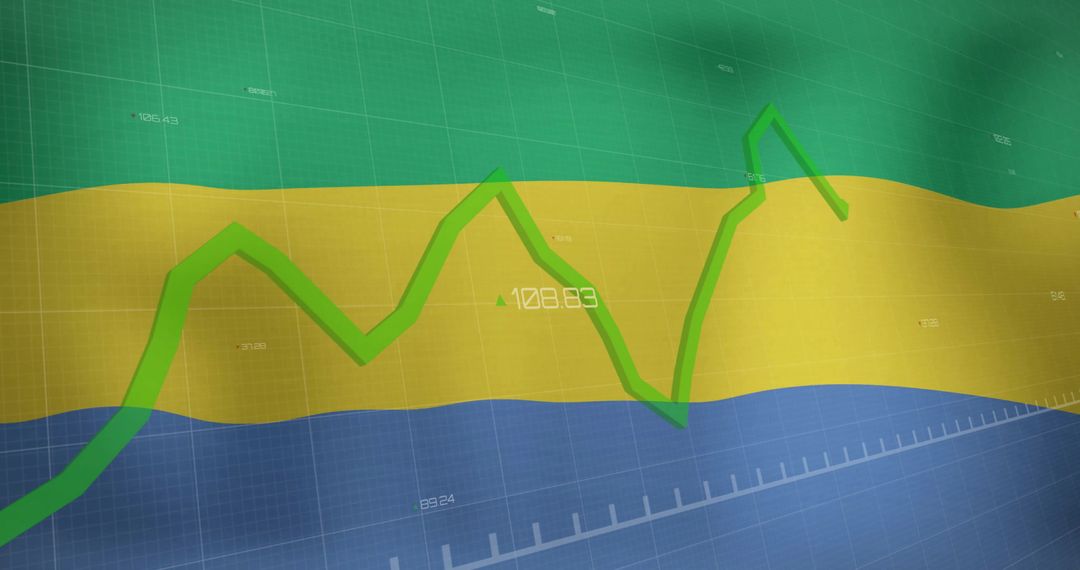
- Economic Data Visualization of Chad Flag Colors
Economic Data Visualization of Chad Flag Colors Image

Abstract design showing economic graphs against colored background inspired by Chad's flag. Useful for illustrating themes of national economic analysis, business growth presentations, or discussions on financial data involving Chad. Ideal for reports, economic seminars or financial articles.
Powered by 


2
downloads
downloads
Tags:
More
Credit Photo
If you would like to credit the Photo, here are some ways you can do so
Text Link
photo Link
<span class="text-link">
<span>
<a target="_blank" href=https://pikwizard.com/photo/economic-data-visualization-of-chad-flag-colors/25ac5e9246c1fd4e75d0527bfdf28fef/>PikWizard</a>
</span>
</span>
<span class="image-link">
<span
style="margin: 0 0 20px 0; display: inline-block; vertical-align: middle; width: 100%;"
>
<a
target="_blank"
href="https://pikwizard.com/photo/economic-data-visualization-of-chad-flag-colors/25ac5e9246c1fd4e75d0527bfdf28fef/"
style="text-decoration: none; font-size: 10px; margin: 0;"
>
<img src="https://pikwizard.com/pw/medium/25ac5e9246c1fd4e75d0527bfdf28fef.jpg" style="margin: 0; width: 100%;" alt="" />
<p style="font-size: 12px; margin: 0;">PikWizard</p>
</a>
</span>
</span>
Free (free of charge)
Free for personal and commercial use.
Author: Creative Art
Similar Free Stock Images