
- Home >
- Stock Photos >
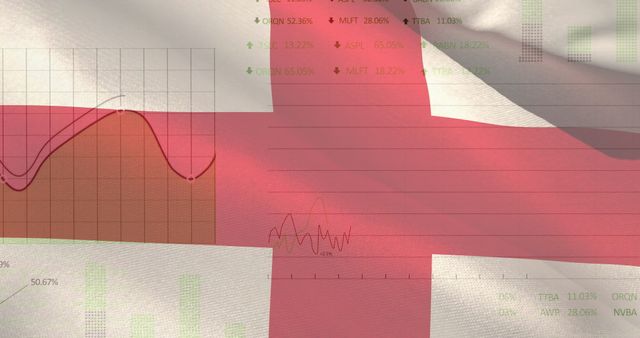
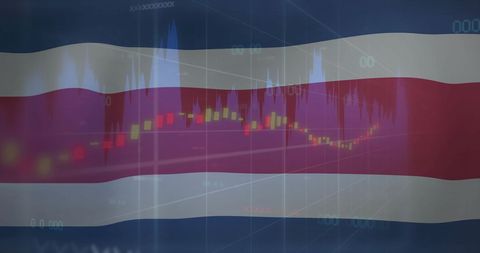
- Economic Data Visualization Over Georgia Flag
Economic Data Visualization Over Georgia Flag Image
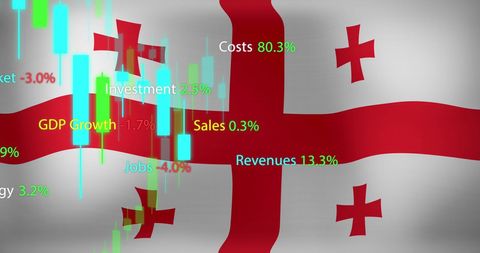
Illustration showing various financial data points and statistics overlaid on the Georgia flag. Bars and percentages in vibrant colors represent costs, investments, sales, and GDP growth. Suitable for presentations on global economics, market trends, and digital finance analysis within Georgia.
Powered by  - Get 15% off with code: PIKWIZARD15


downloads
Tags:
More
Credit Photo
If you would like to credit the Photo, here are some ways you can do so
Text Link
photo Link
<span class="text-link">
<span>
<a target="_blank" href=https://pikwizard.com/photo/economic-data-visualization-over-georgia-flag/e14799197e27016371ab3edcfca3194d/>PikWizard</a>
</span>
</span>
<span class="image-link">
<span
style="margin: 0 0 20px 0; display: inline-block; vertical-align: middle; width: 100%;"
>
<a
target="_blank"
href="https://pikwizard.com/photo/economic-data-visualization-over-georgia-flag/e14799197e27016371ab3edcfca3194d/"
style="text-decoration: none; font-size: 10px; margin: 0;"
>
<img src="https://pikwizard.com/pw/medium/e14799197e27016371ab3edcfca3194d.jpg" style="margin: 0; width: 100%;" alt="" />
<p style="font-size: 12px; margin: 0;">PikWizard</p>
</a>
</span>
</span>
Free (free of charge)
Free for personal and commercial use.
Author: Authentic Images
Similar Free Stock Images
Premium


Premium

Premium


Premium


Premium

Premium

Premium

Premium


Premium


Premium

Premium


Premium


Premium


Premium

Premium


Premium

Premium

Premium

Premium


Premium


Premium

Premium


Premium

Premium


Premium


Explore More Free Stock Images