- Home >
- Stock Photos >
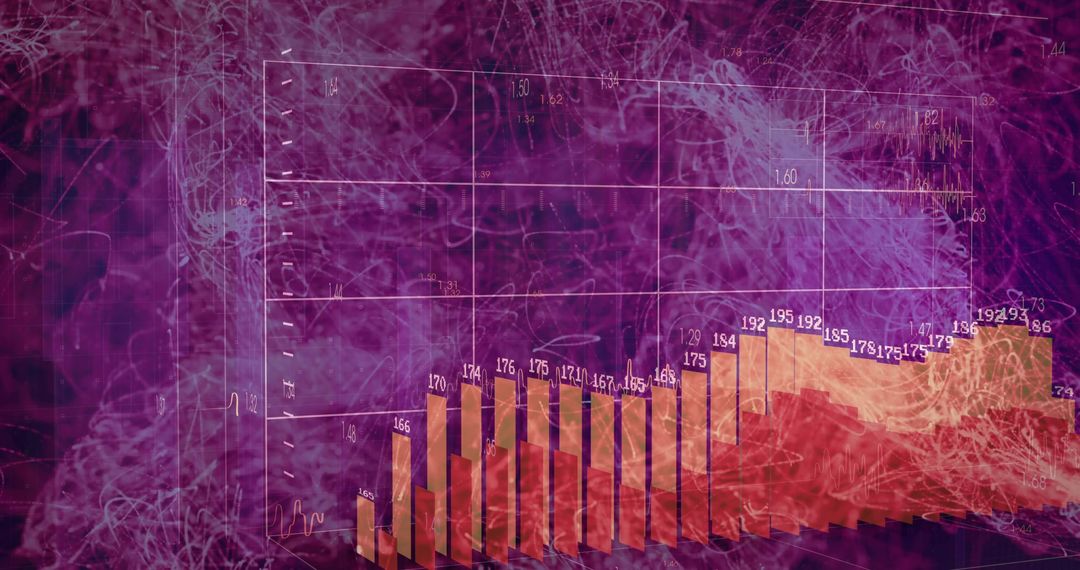
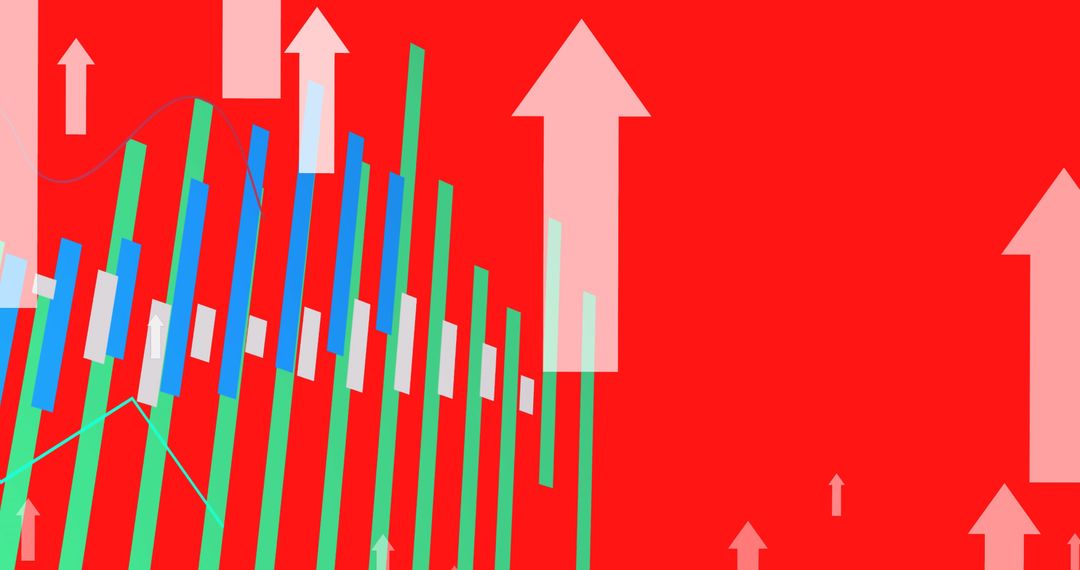
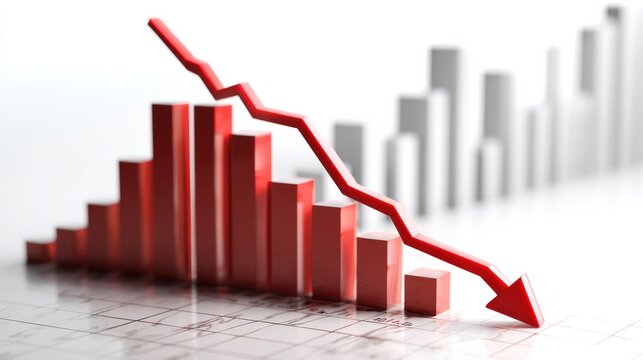
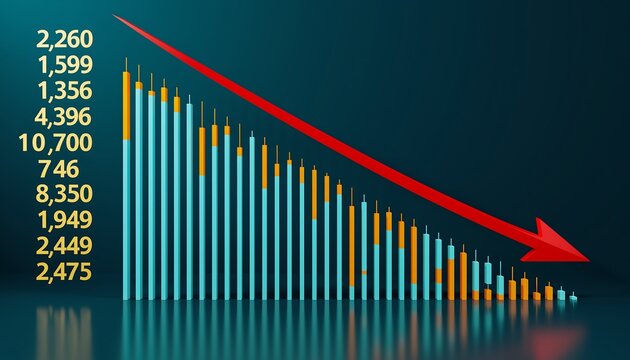
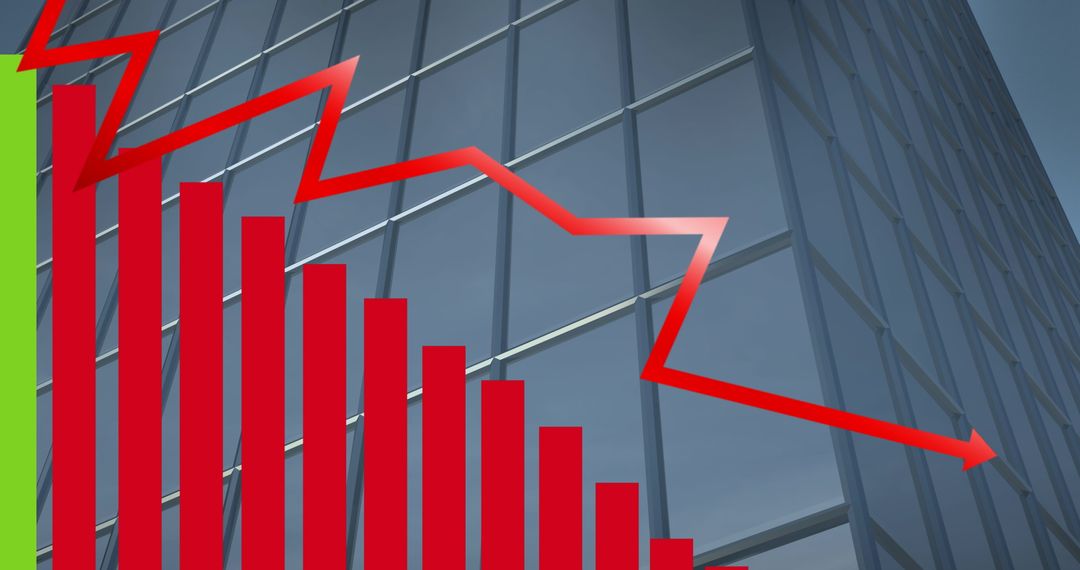
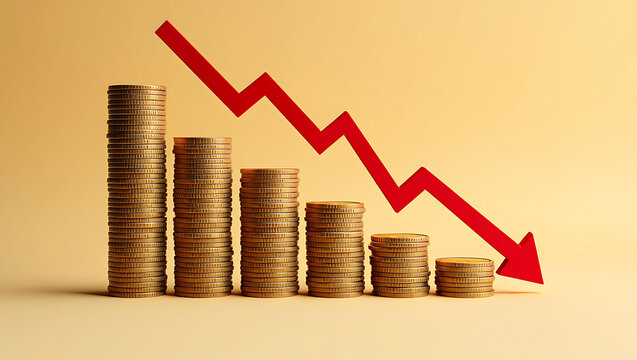
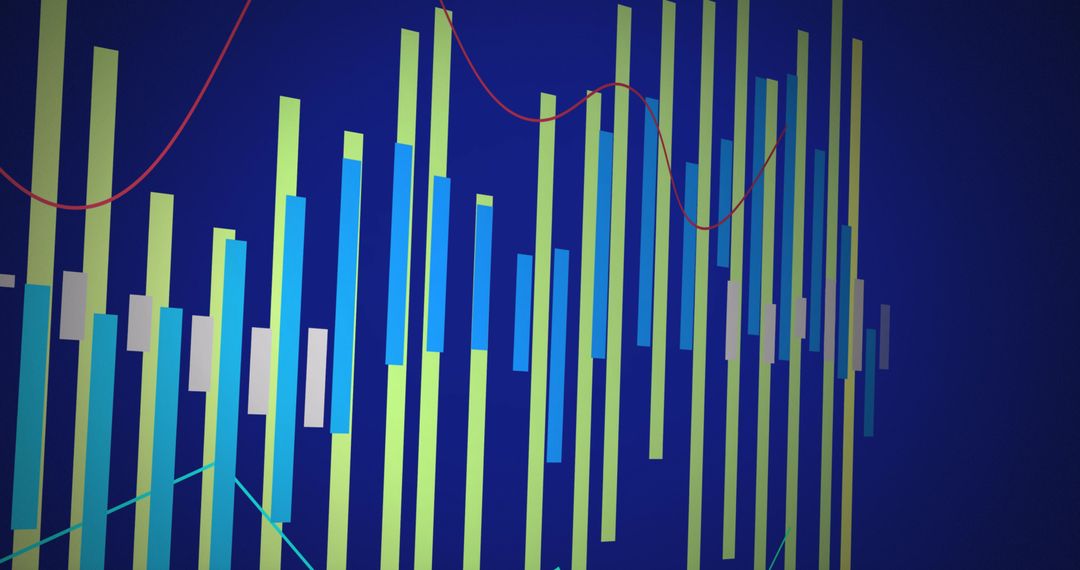
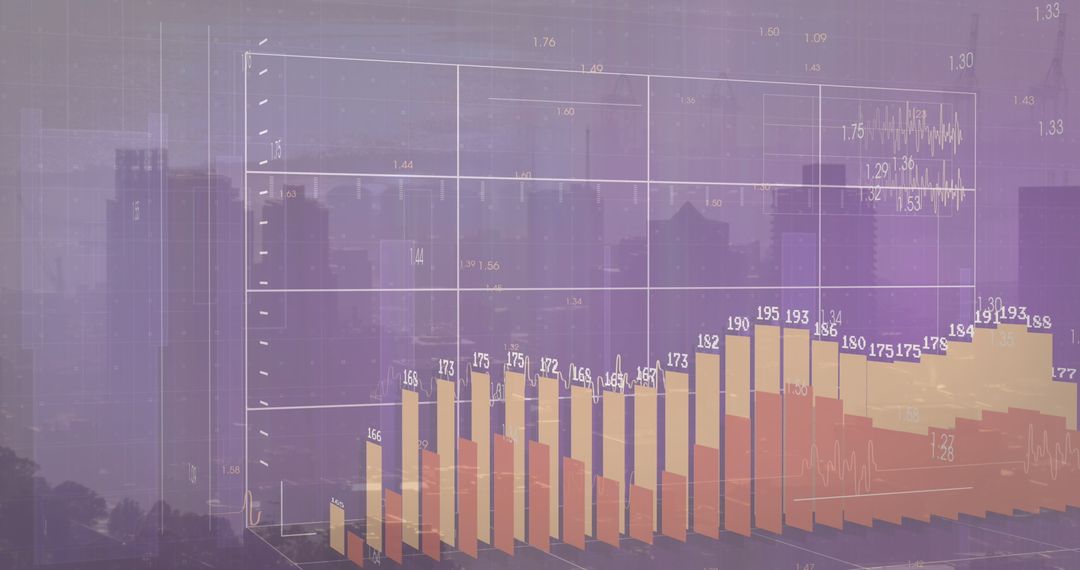
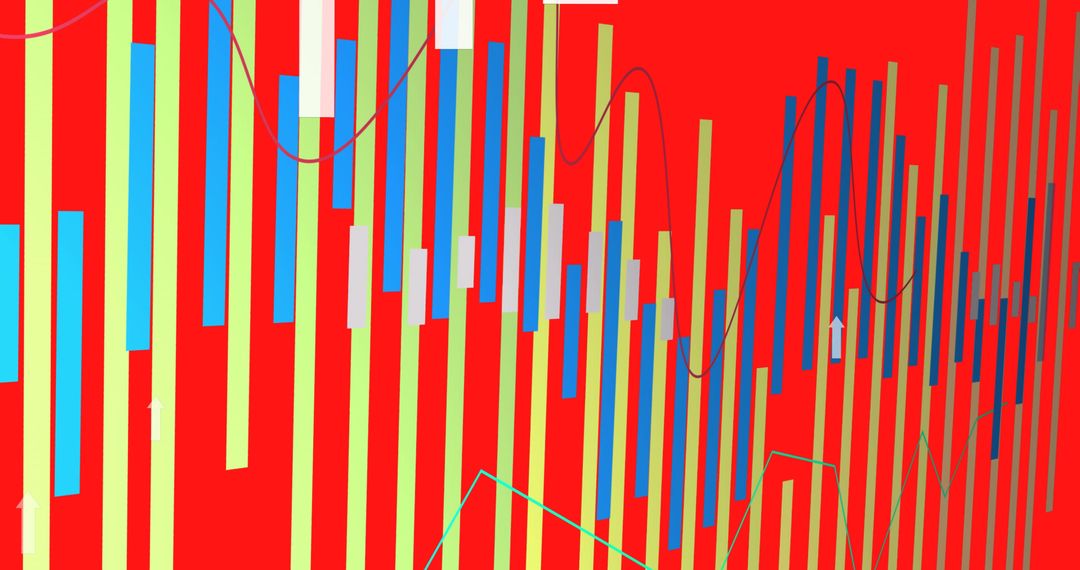
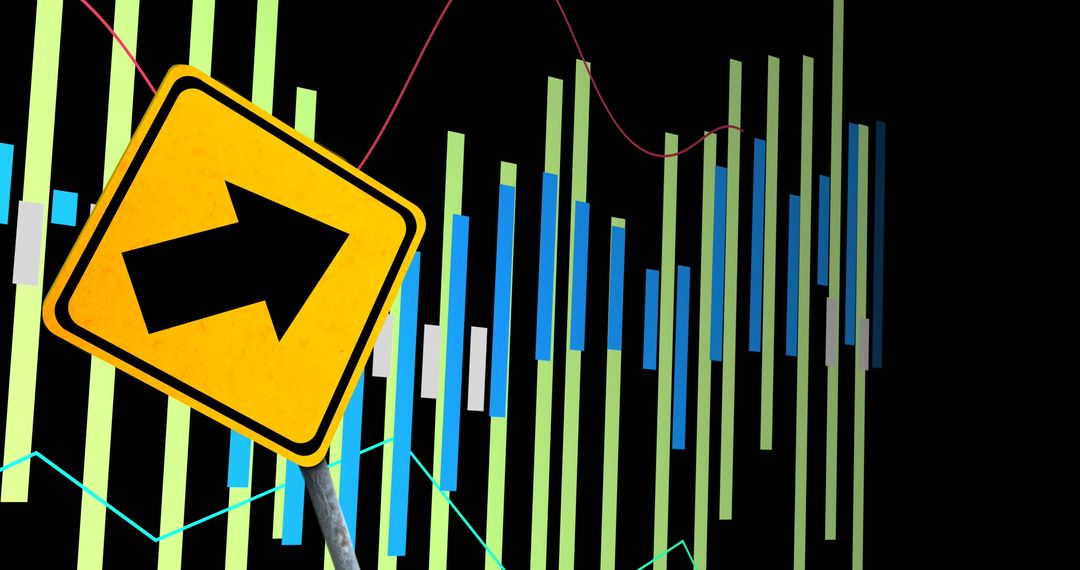
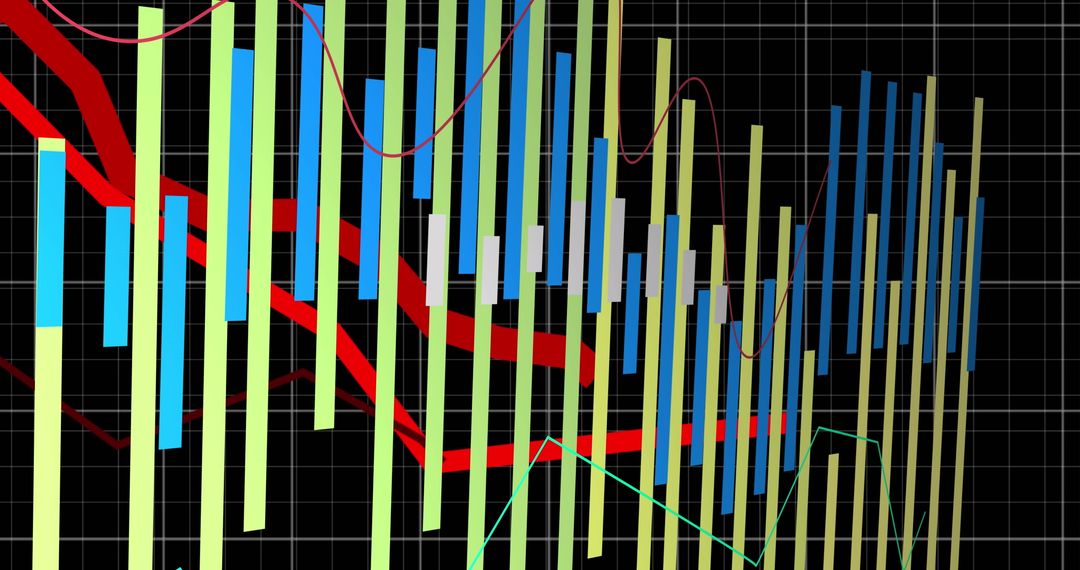
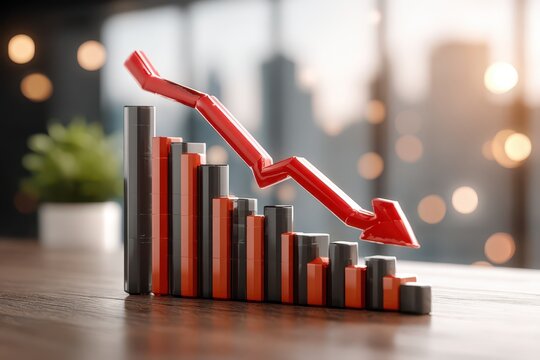
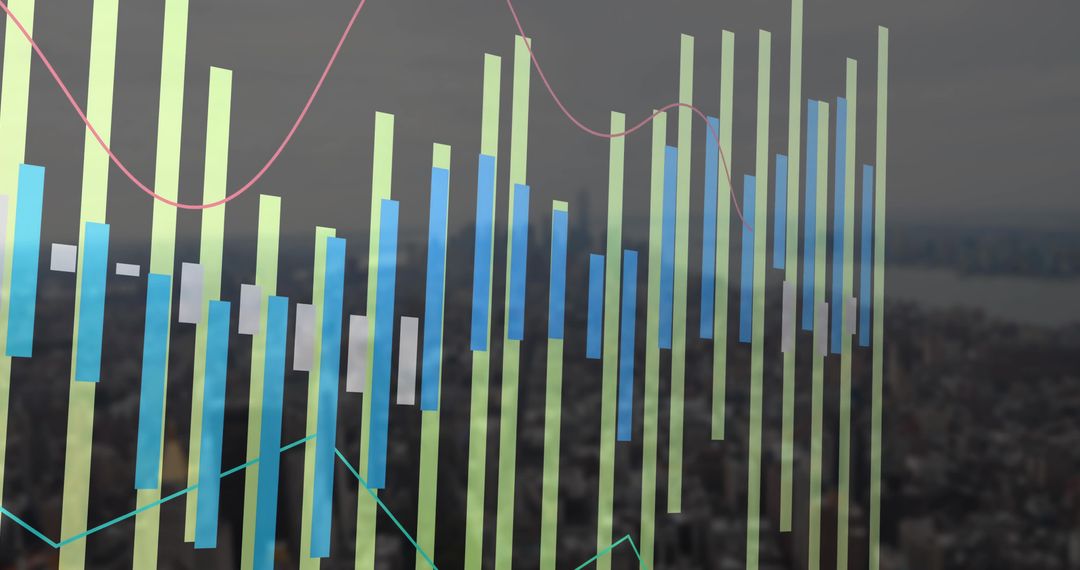
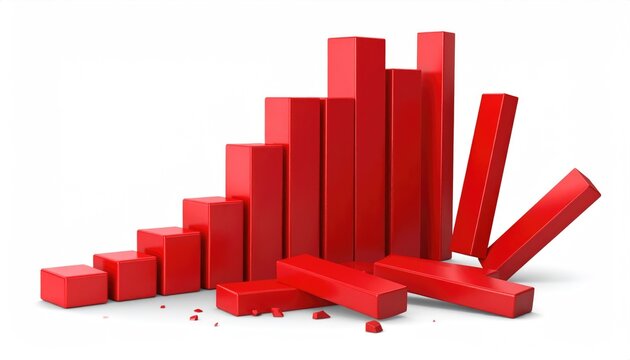
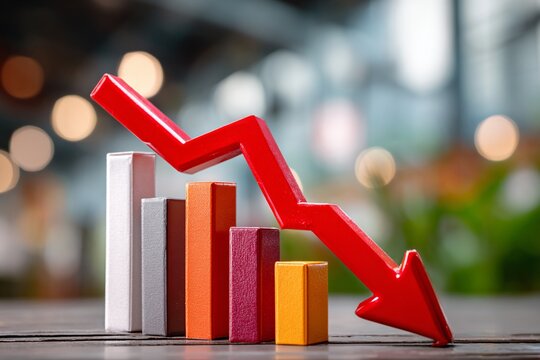
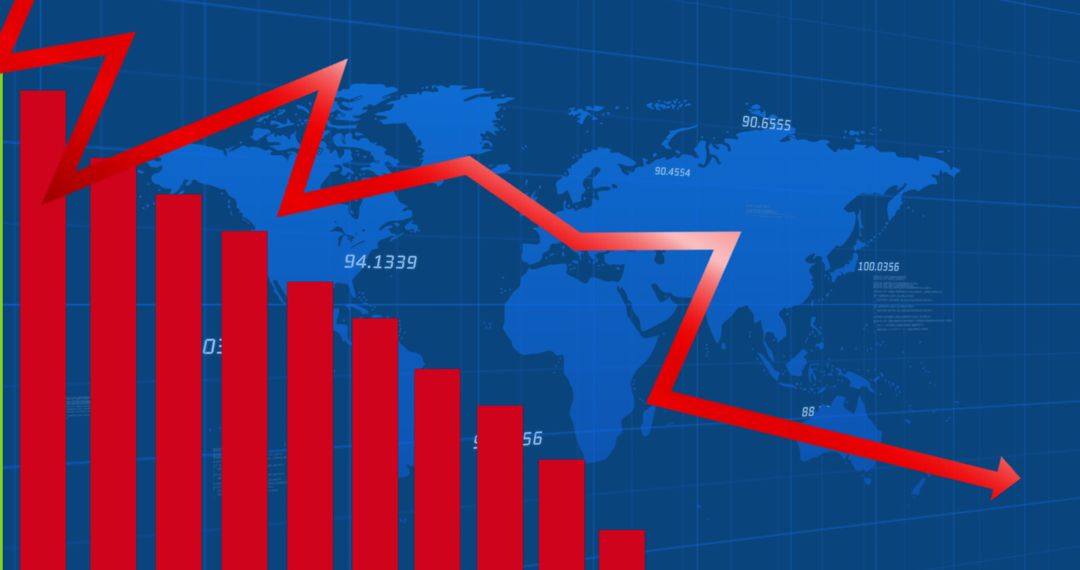
- Economic Decline Concept with Red Bar Graph and Downward Chart Line
Economic Decline Concept with Red Bar Graph and Downward Chart Line Image
Bars represent financial data in shades of red and one segment in green, indicating fluctuation and decline. Downward moving red line underscores idea of poor business, potential for illustrating concepts like recession or harmful market trends. Useful for articles or blogs on business analysis, economic struggle, or statistical evaluations. Easily interpretable shorthand for financial loss. Could enhance presentations or reports involving negative impacts or comparative historical roles in fiscal planning.
Powered by 


3
downloads
downloads
Tags:
More
Credit Photo
If you would like to credit the Photo, here are some ways you can do so
Text Link
photo Link
<span class="text-link">
<span>
<a target="_blank" href=https://pikwizard.com/photo/economic-decline-concept-with-red-bar-graph-and-downward-chart-line/f9a9ca5c980973ff3fd3071757cb9d25/>PikWizard</a>
</span>
</span>
<span class="image-link">
<span
style="margin: 0 0 20px 0; display: inline-block; vertical-align: middle; width: 100%;"
>
<a
target="_blank"
href="https://pikwizard.com/photo/economic-decline-concept-with-red-bar-graph-and-downward-chart-line/f9a9ca5c980973ff3fd3071757cb9d25/"
style="text-decoration: none; font-size: 10px; margin: 0;"
>
<img src="https://pikwizard.com/pw/medium/f9a9ca5c980973ff3fd3071757cb9d25.jpg" style="margin: 0; width: 100%;" alt="" />
<p style="font-size: 12px; margin: 0;">PikWizard</p>
</a>
</span>
</span>
Free (free of charge)
Free for personal and commercial use.
Author: Creative Art
Similar Free Stock Images

Premium


Premium


Premium


Premium
Premium


Premium


Premium


Premium


Premium


Premium


Premium


Premium


Premium

Premium


Premium


Premium


Premium

Premium


Premium


Premium


Premium
Premium

Premium


Premium