- Home >
- Stock Photos >
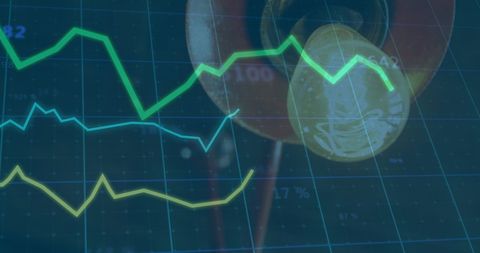
- Economic Decline Representation on Graph with Light Bulbs
Economic Decline Representation on Graph with Light Bulbs Image
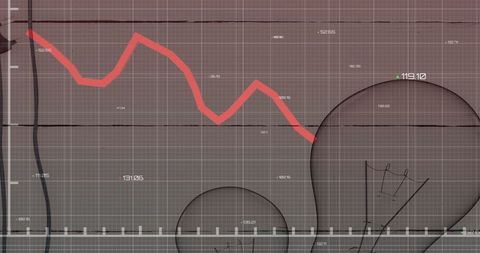
Illustrates a decreasing graph in red overlaid with light bulbs suggesting ideas or potential insights into economic challenges. Useful for publications and presentations regarding economic analysis, downturns, financial calculus, crisis communication strategies, or discussions on possible sov21 DIY pm scaled-ie strategies and budget planning.
Powered by 


2
downloads
downloads
Tags:
More
Credit Photo
If you would like to credit the Photo, here are some ways you can do so
Text Link
photo Link
<span class="text-link">
<span>
<a target="_blank" href=https://pikwizard.com/photo/economic-decline-representation-on-graph-with-light-bulbs/715ad28c2623ad7a4fb22bfba408c8a0/>PikWizard</a>
</span>
</span>
<span class="image-link">
<span
style="margin: 0 0 20px 0; display: inline-block; vertical-align: middle; width: 100%;"
>
<a
target="_blank"
href="https://pikwizard.com/photo/economic-decline-representation-on-graph-with-light-bulbs/715ad28c2623ad7a4fb22bfba408c8a0/"
style="text-decoration: none; font-size: 10px; margin: 0;"
>
<img src="https://pikwizard.com/pw/medium/715ad28c2623ad7a4fb22bfba408c8a0.jpg" style="margin: 0; width: 100%;" alt="" />
<p style="font-size: 12px; margin: 0;">PikWizard</p>
</a>
</span>
</span>
Free (free of charge)
Free for personal and commercial use.
Author: People Creations
Similar Free Stock Images
Loading...

Premium


Premium

Premium


Premium


Premium


Premium

Premium


Premium


Premium


Premium


Premium


Premium


Premium


Premium


Premium

Premium


Premium


Premium


Premium


Premium


Premium
Premium

Premium

Premium


Premium