- Home >
- Stock Photos >
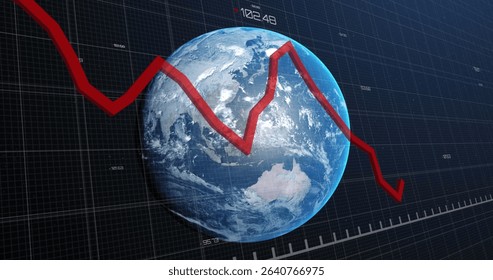
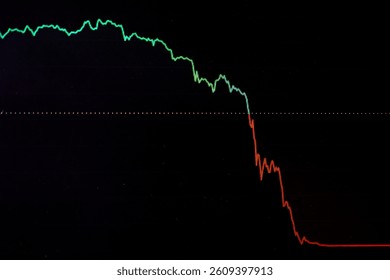
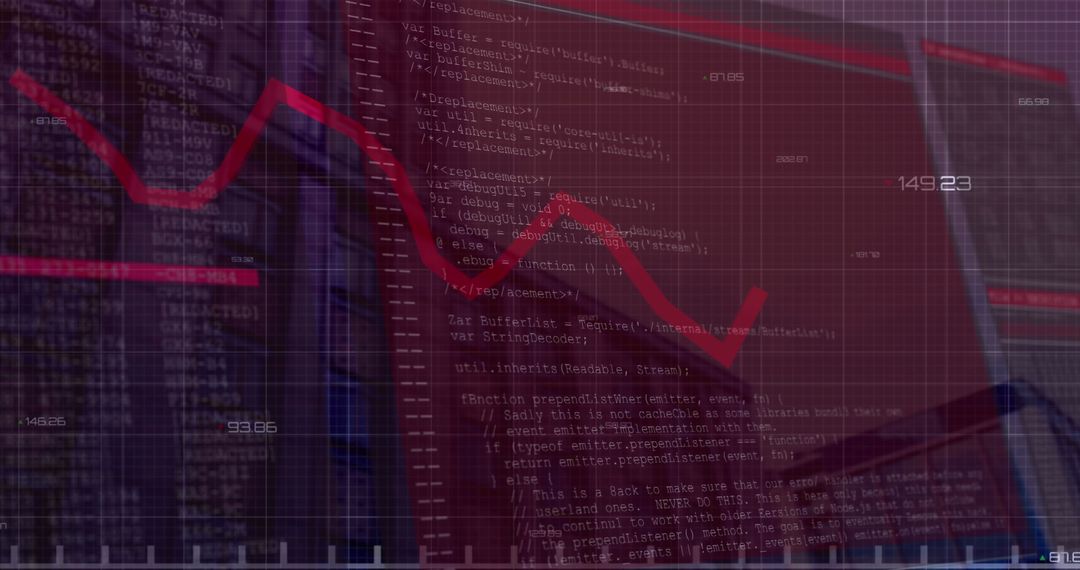
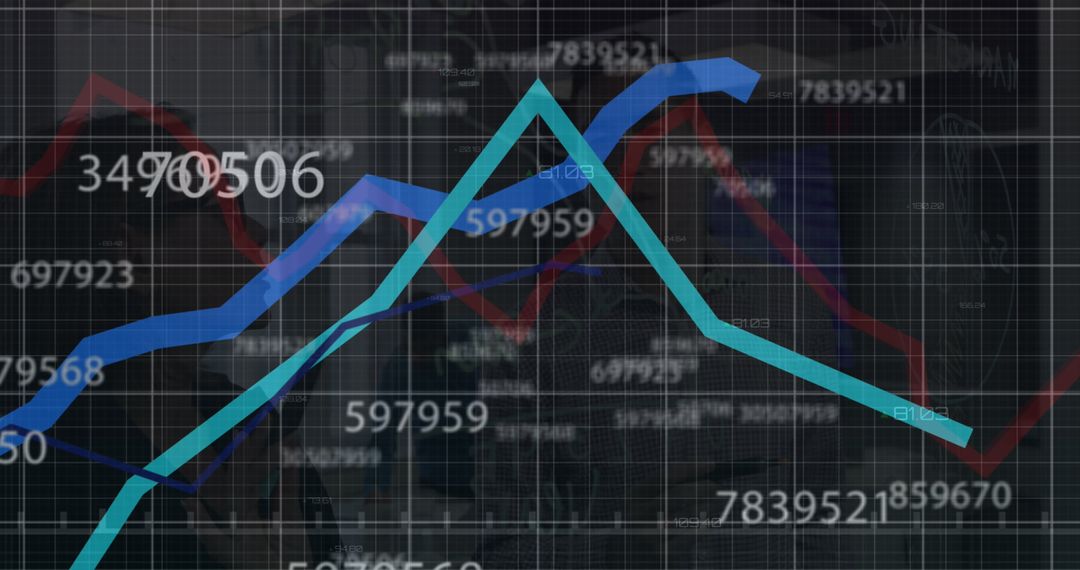
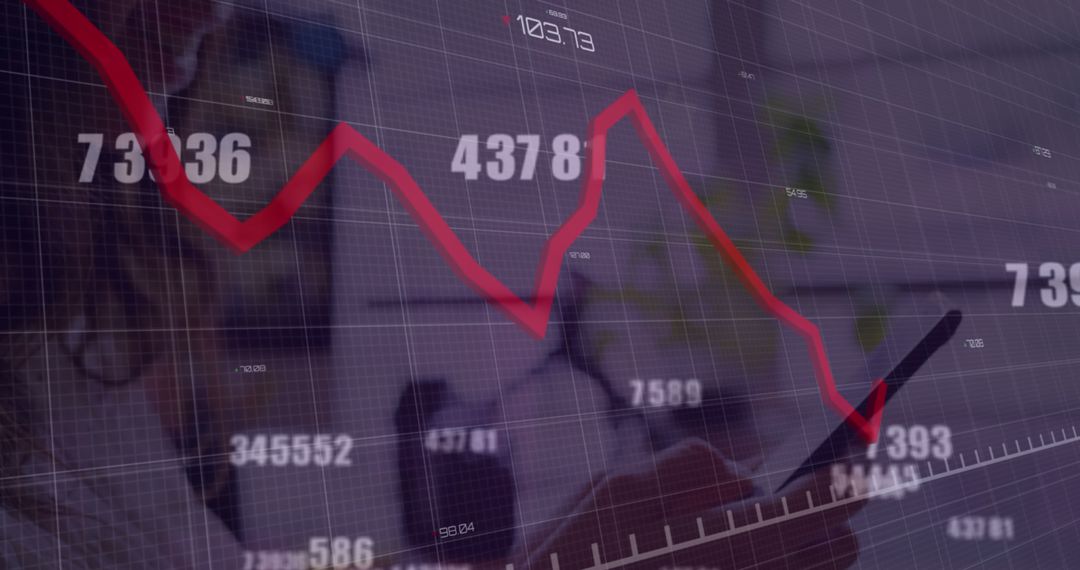
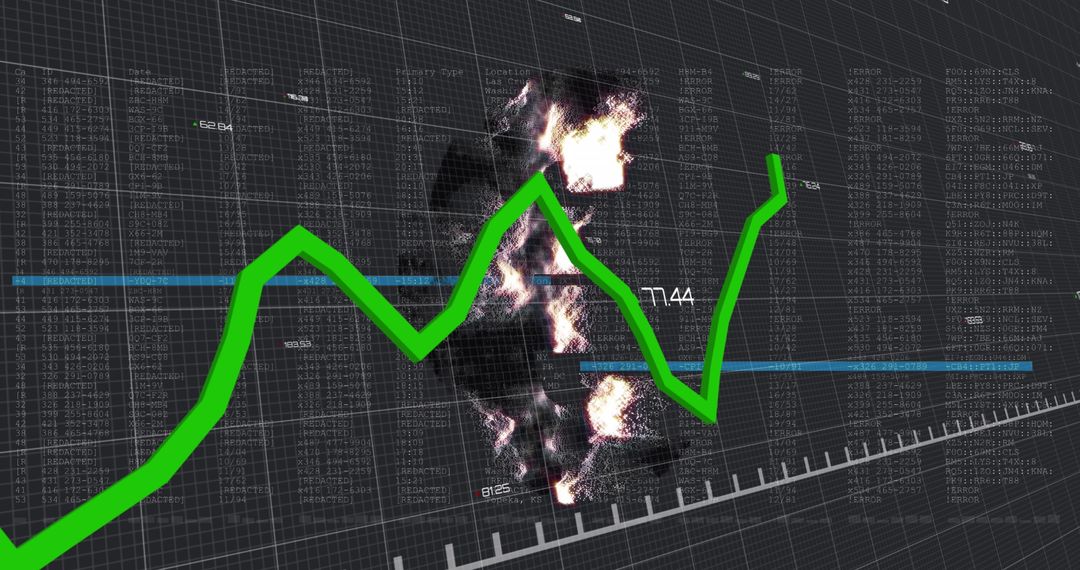
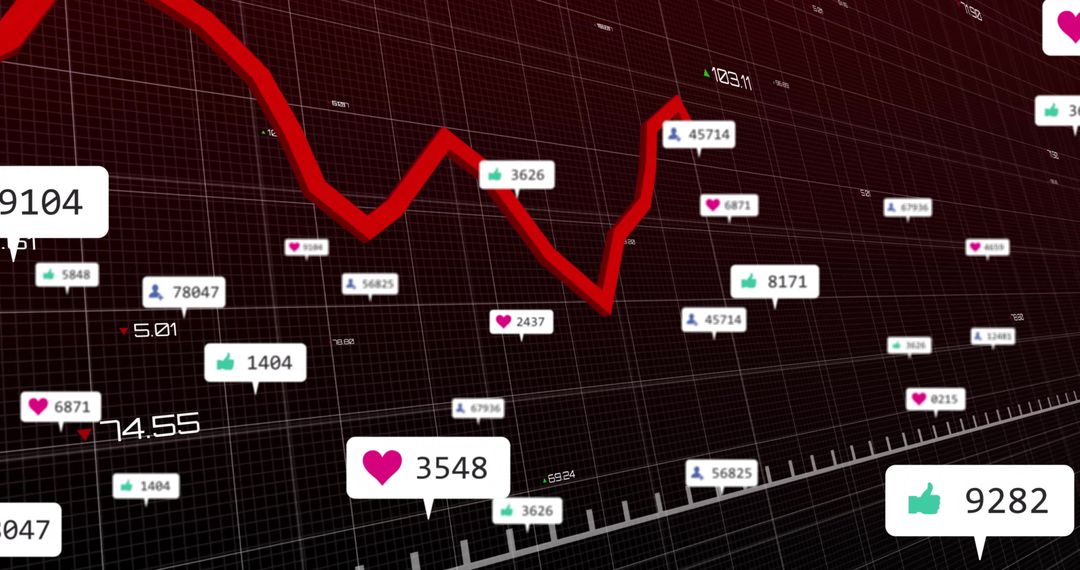
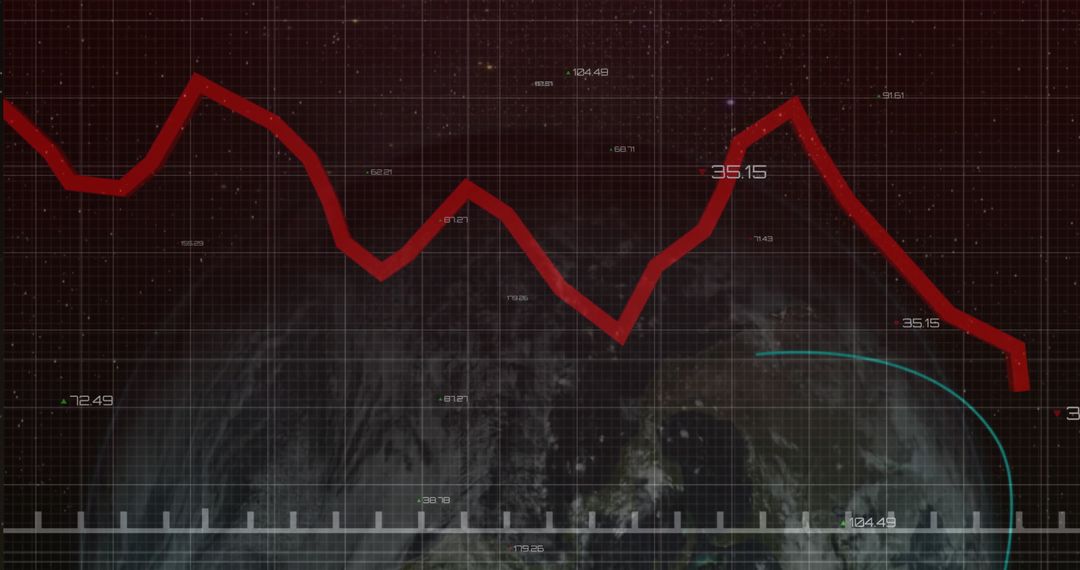
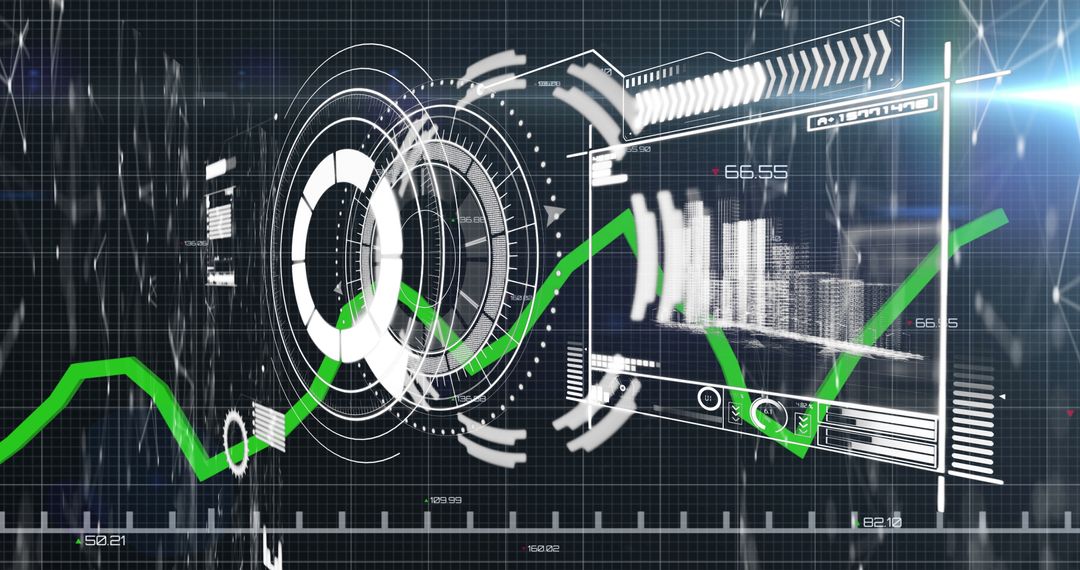
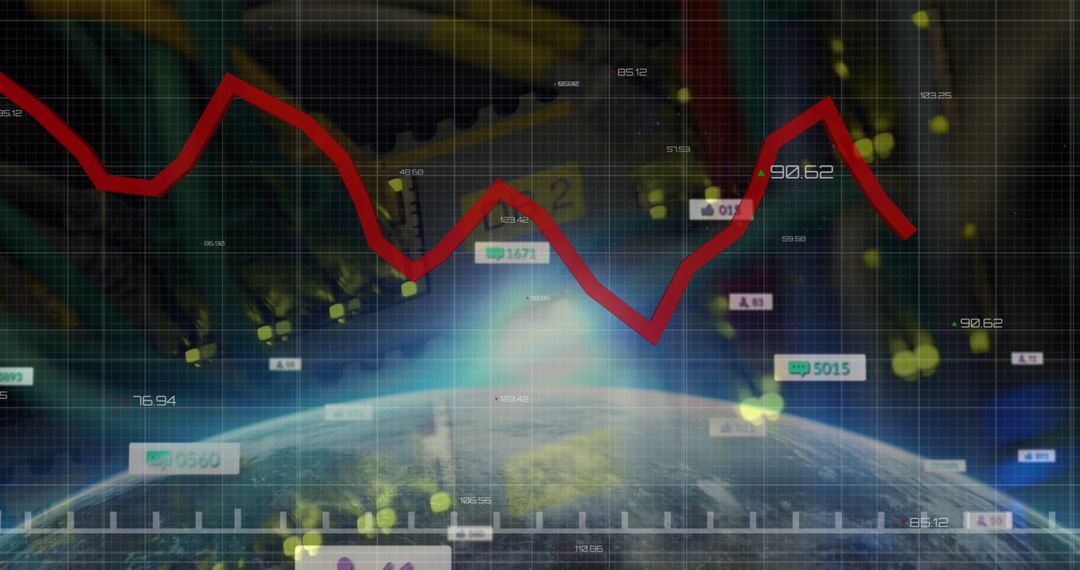
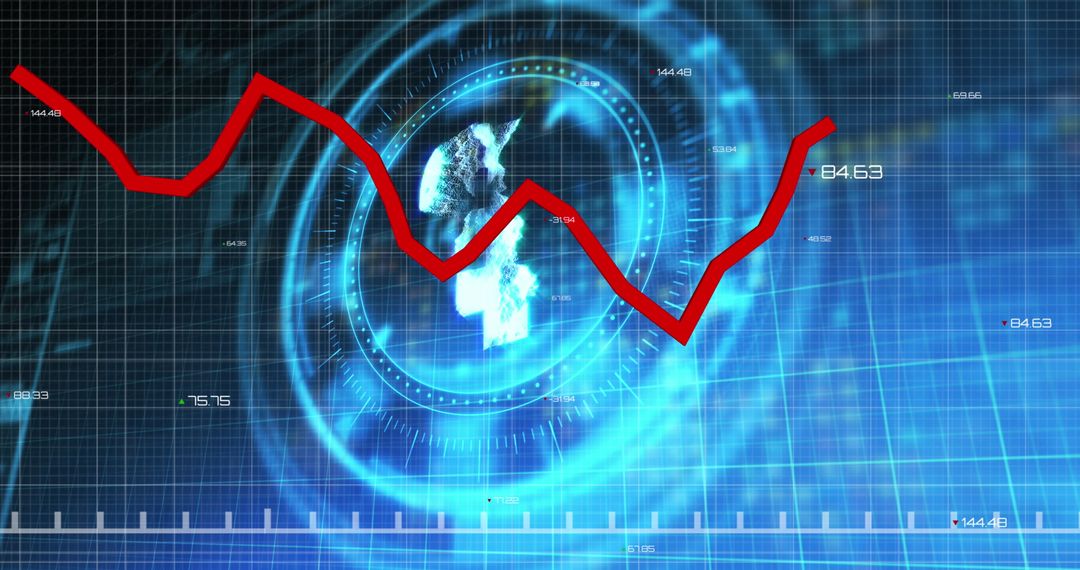
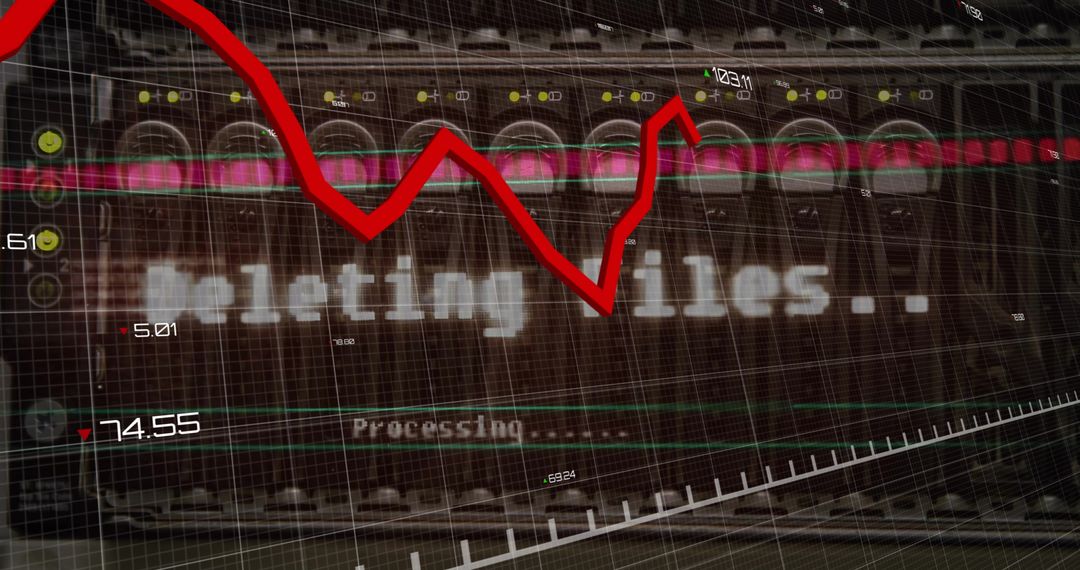
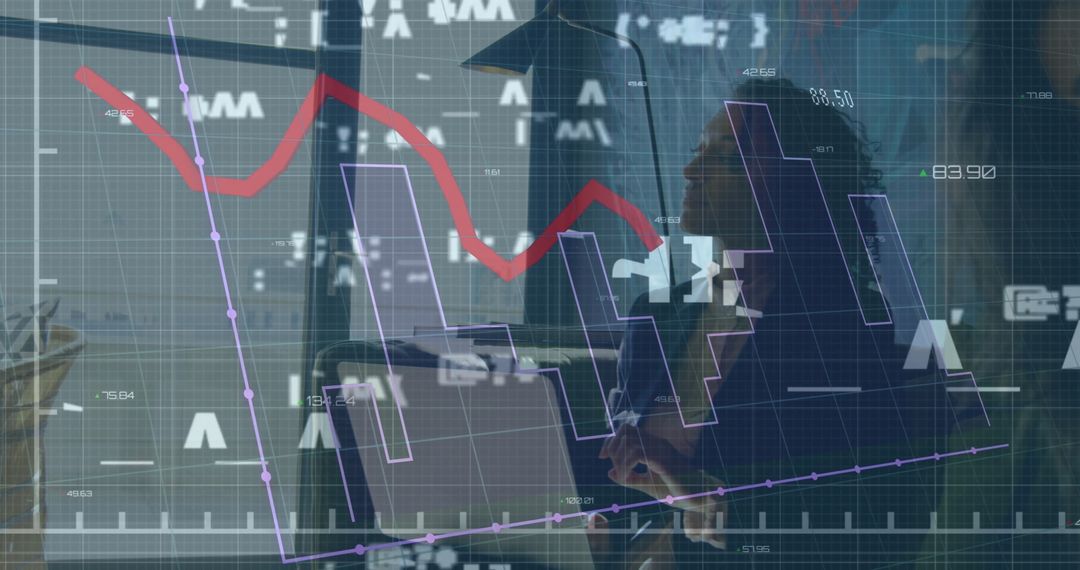
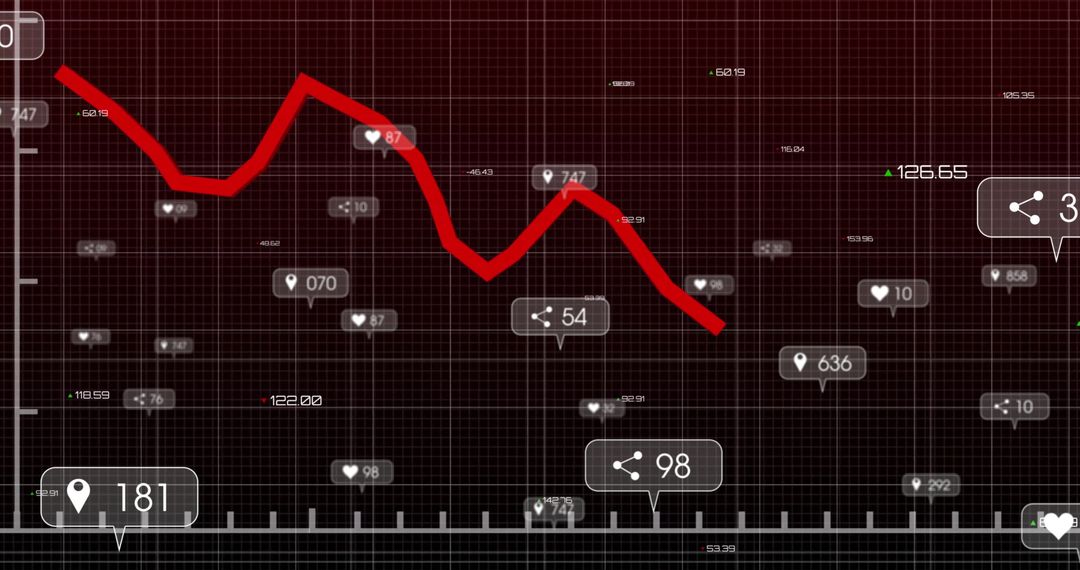
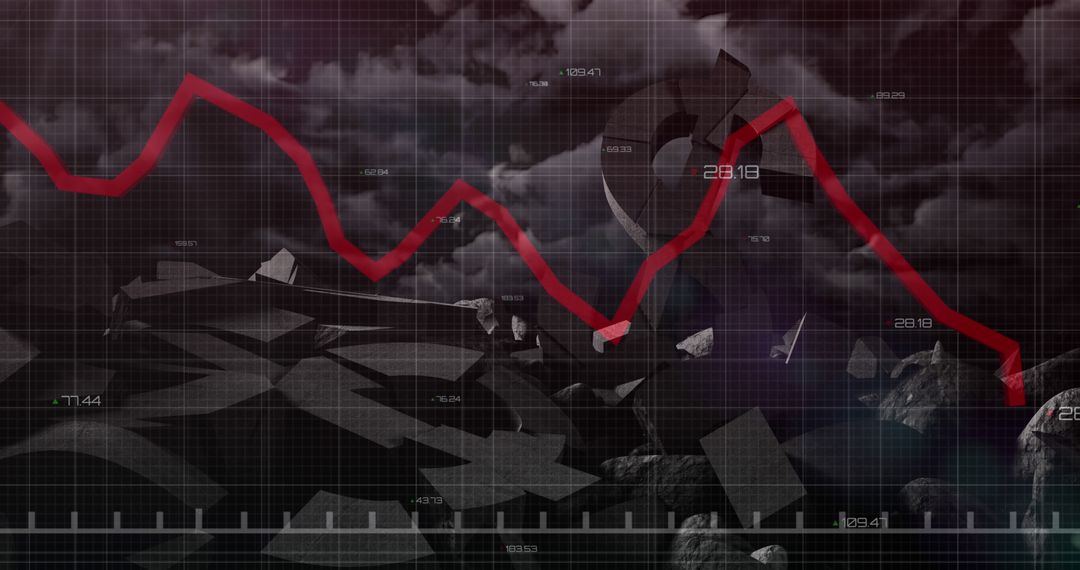
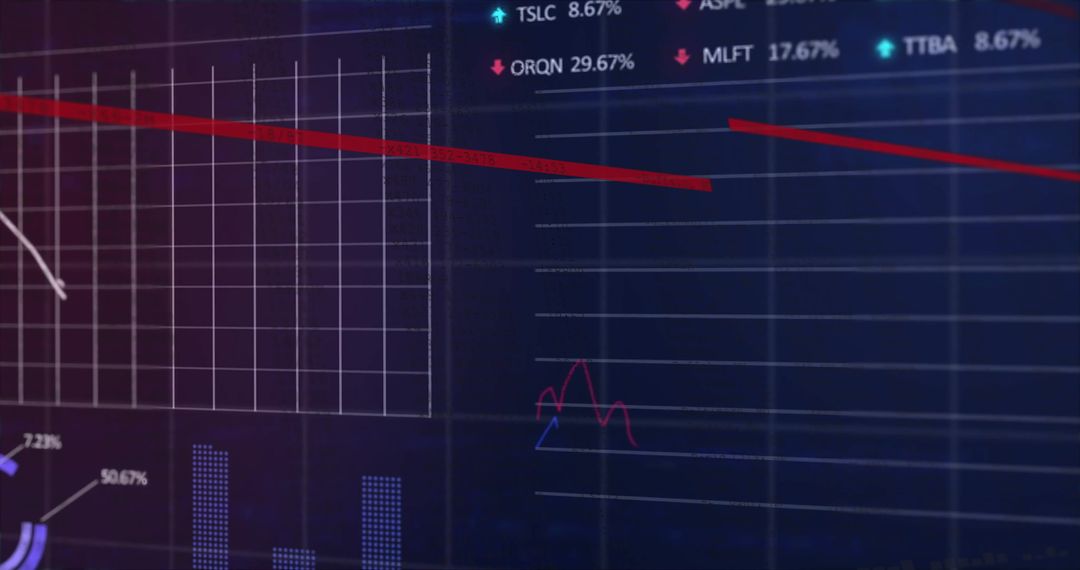
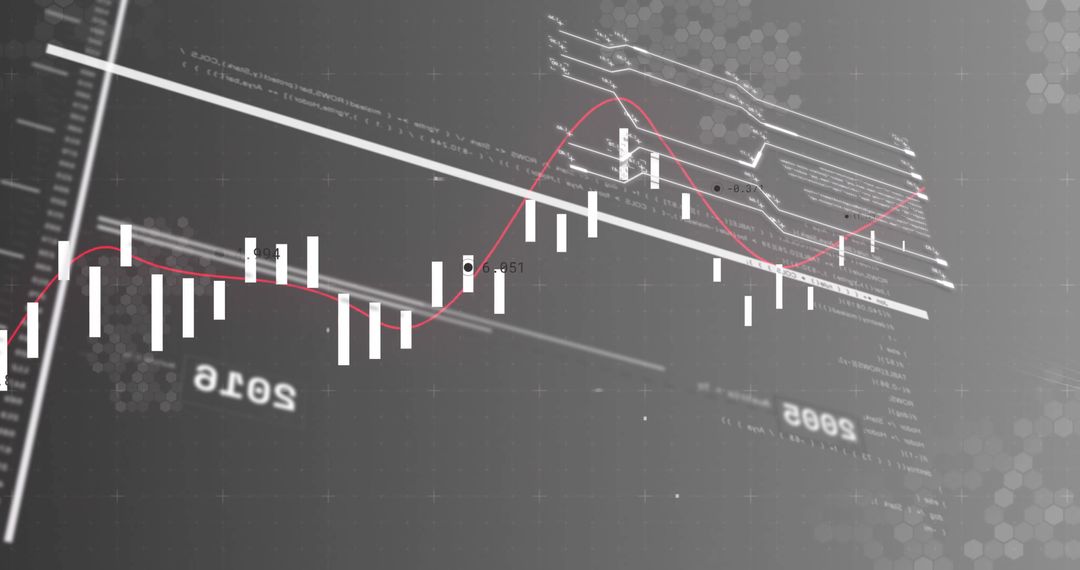
- Economic Downturn Concept on Trading Dashboard with Data Visualization
Economic Downturn Concept on Trading Dashboard with Data Visualization Image
This illustrates a red line graph exhibiting a downward trajectory, superimposed on a high-tech trading dashboard. Focus on financial monitoring and rests against a gridded backdrop with multiple data panels suggesting cascades of information flow. Suitable for content related to stock market analysis, economic downturns, financial technology advancements, data visualization practices, displayed statistical data points on deteriorating market scenarios.
Powered by  - Get 15% off with code: PIKWIZARD15


0
downloads
downloads
Tags:
More
Credit Photo
If you would like to credit the Photo, here are some ways you can do so
Text Link
photo Link
<span class="text-link">
<span>
<a target="_blank" href=https://pikwizard.com/photo/economic-downturn-concept-on-trading-dashboard-with-data-visualization/a0a652f15f0e0c4e2eb6e95c67b310d0/>PikWizard</a>
</span>
</span>
<span class="image-link">
<span
style="margin: 0 0 20px 0; display: inline-block; vertical-align: middle; width: 100%;"
>
<a
target="_blank"
href="https://pikwizard.com/photo/economic-downturn-concept-on-trading-dashboard-with-data-visualization/a0a652f15f0e0c4e2eb6e95c67b310d0/"
style="text-decoration: none; font-size: 10px; margin: 0;"
>
<img src="https://pikwizard.com/pw/medium/a0a652f15f0e0c4e2eb6e95c67b310d0.jpg" style="margin: 0; width: 100%;" alt="" />
<p style="font-size: 12px; margin: 0;">PikWizard</p>
</a>
</span>
</span>
Free (free of charge)
Free for personal and commercial use.
Author: Authentic Images
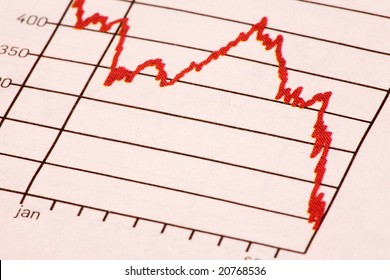
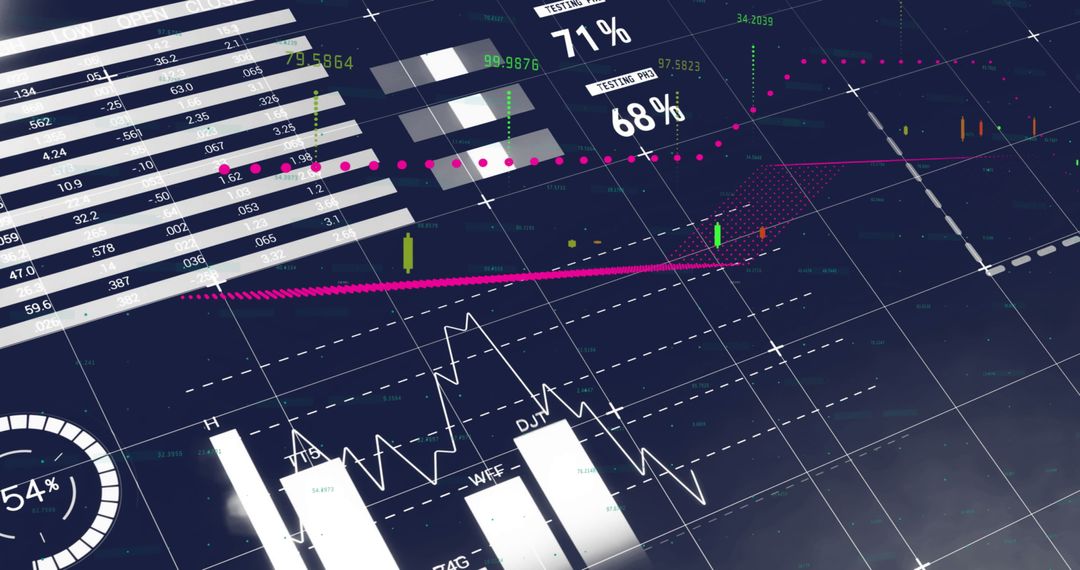
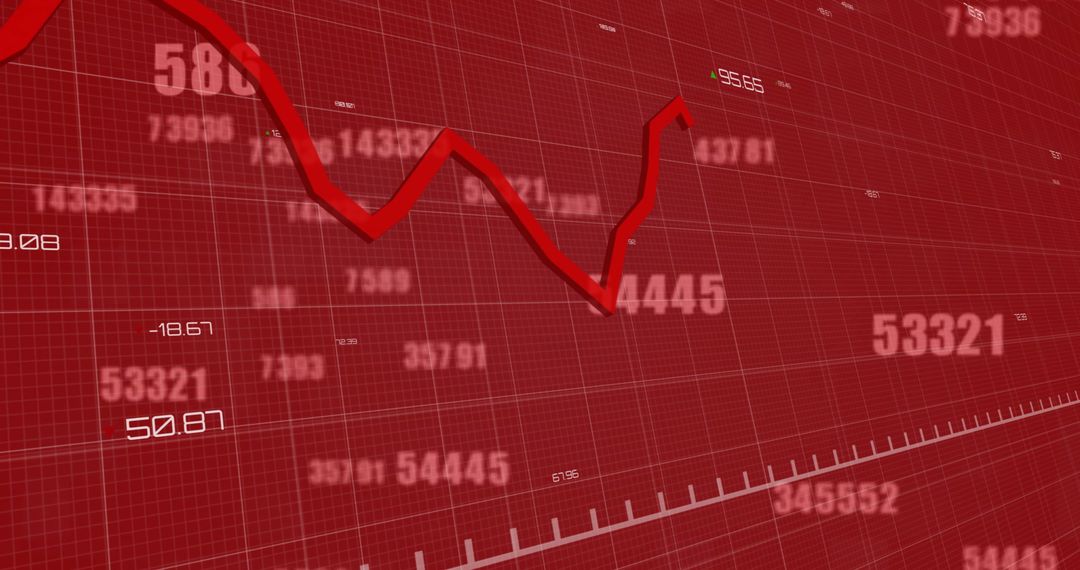
Similar Free Stock Images

Premium


Premium


Premium


Premium


Premium


Premium


Premium


Premium


Premium


Premium


Premium


Premium

Premium


Premium


Premium


Premium


Premium


Premium


Premium


Premium


Premium


Premium


Premium


Premium