- Home >
- Stock Photos >
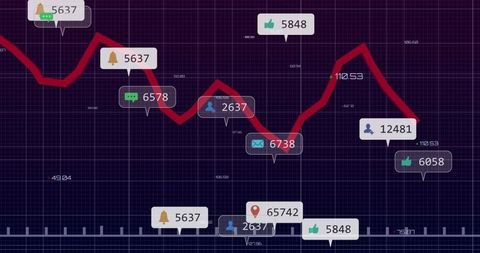
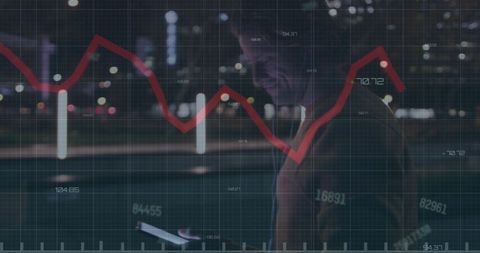
- Economic Downturn in Festive Context with Easter Eggs
Economic Downturn in Festive Context with Easter Eggs Image

Illustration features a red line graph displaying a downward trend set against a digital grid backdrop adorned with Easter eggs. This composition suggests the merging of economic themes with festive elements. Useful for articles or presentations discussing economic trends during holiday seasons, fiscal reviews incorporating cultural references, or visual placeholder for financial downturn content.
Powered by  - Get 15% off with code: PIKWIZARD15


downloads
Tags:
More
Credit Photo
If you would like to credit the Photo, here are some ways you can do so
Text Link
photo Link
<span class="text-link">
<span>
<a target="_blank" href=https://pikwizard.com/photo/economic-downturn-in-festive-context-with-easter-eggs/338fe8109d3d7b94eabc21319522c51e/>PikWizard</a>
</span>
</span>
<span class="image-link">
<span
style="margin: 0 0 20px 0; display: inline-block; vertical-align: middle; width: 100%;"
>
<a
target="_blank"
href="https://pikwizard.com/photo/economic-downturn-in-festive-context-with-easter-eggs/338fe8109d3d7b94eabc21319522c51e/"
style="text-decoration: none; font-size: 10px; margin: 0;"
>
<img src="https://pikwizard.com/pw/medium/338fe8109d3d7b94eabc21319522c51e.jpg" style="margin: 0; width: 100%;" alt="" />
<p style="font-size: 12px; margin: 0;">PikWizard</p>
</a>
</span>
</span>
Free (free of charge)
Free for personal and commercial use.
Author: Creative Art
Similar Free Stock Images
Loading...

Premium


Premium


Premium


Premium


Premium
Premium


Premium

Premium

Premium


Premium


Premium

Premium

Premium


Premium


Premium


Premium


Premium


Premium


Premium


Premium


Premium

Premium


Premium


Premium


Premium