
- Home >
- Stock Photos >
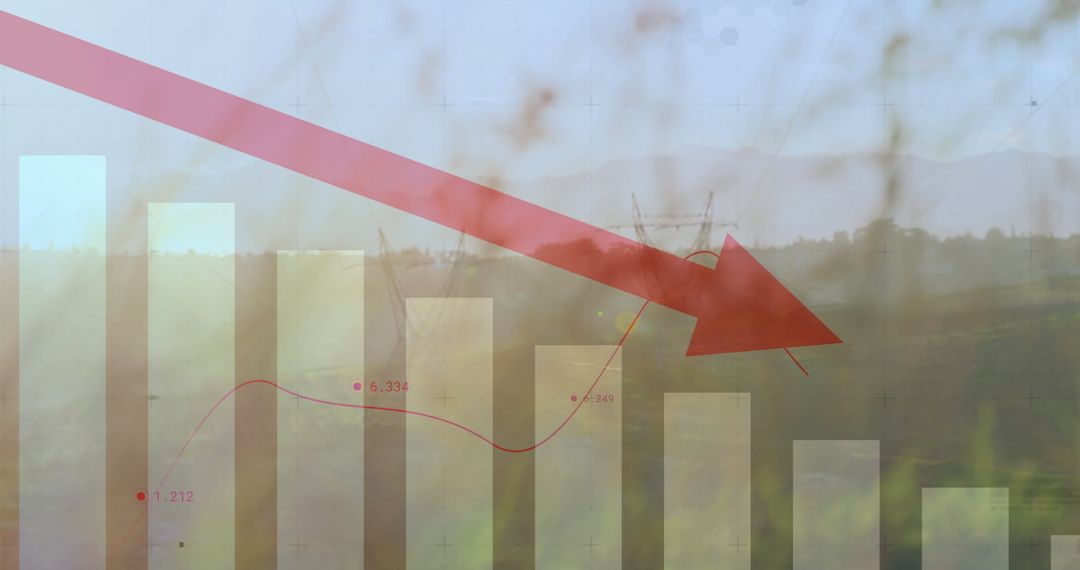
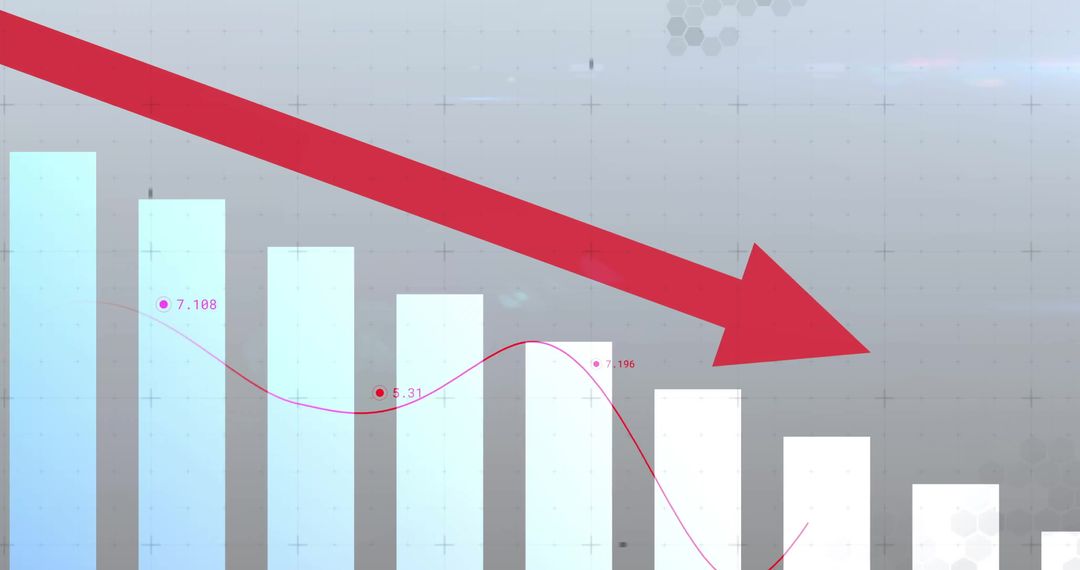
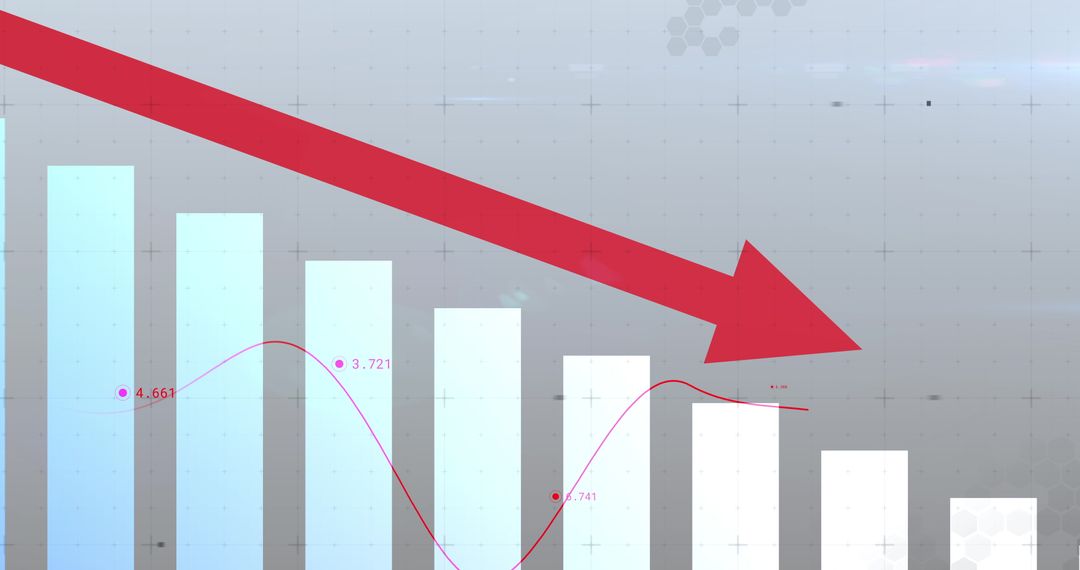
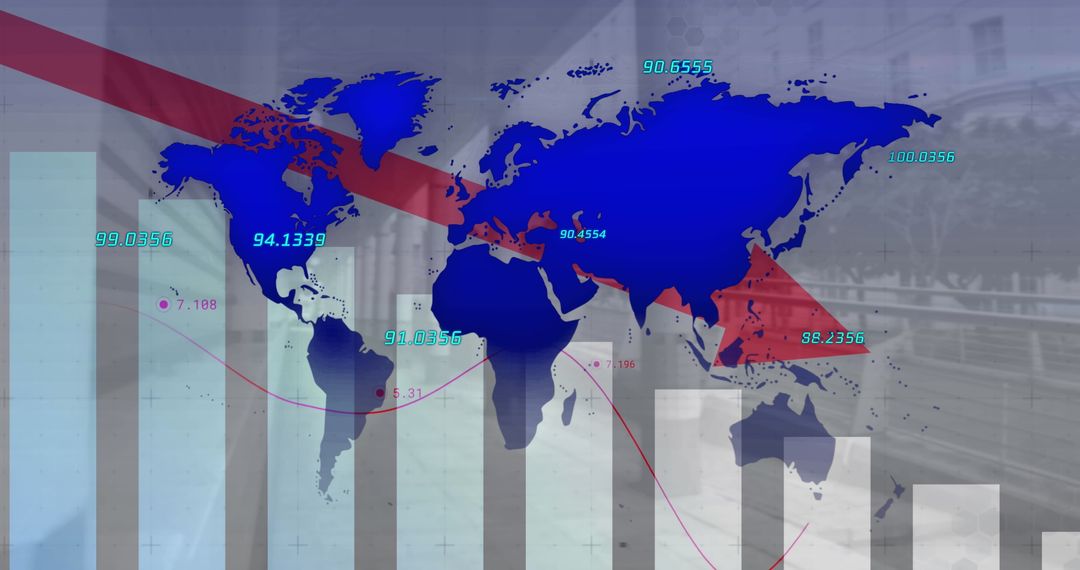
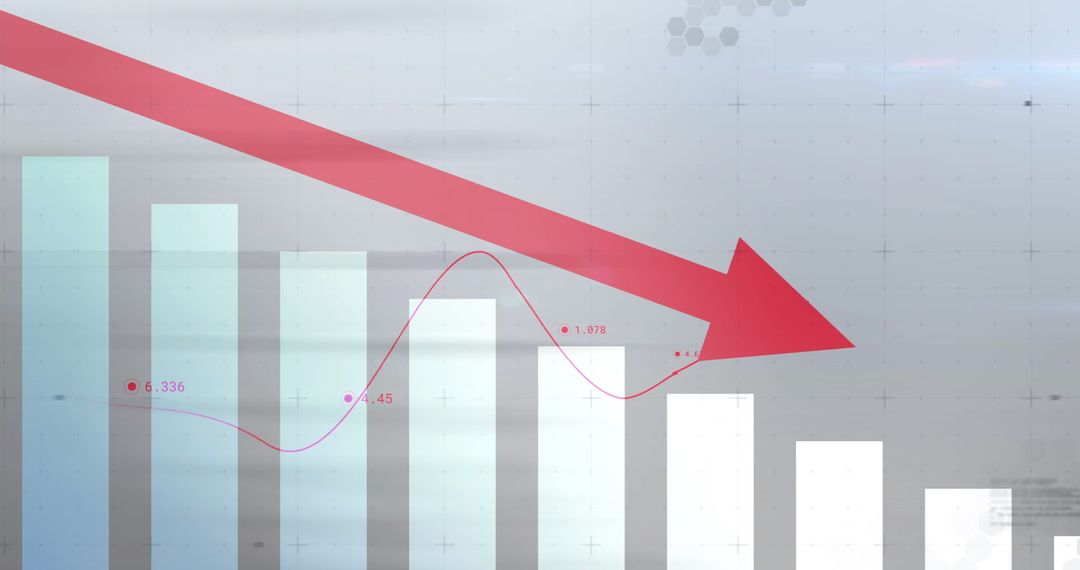
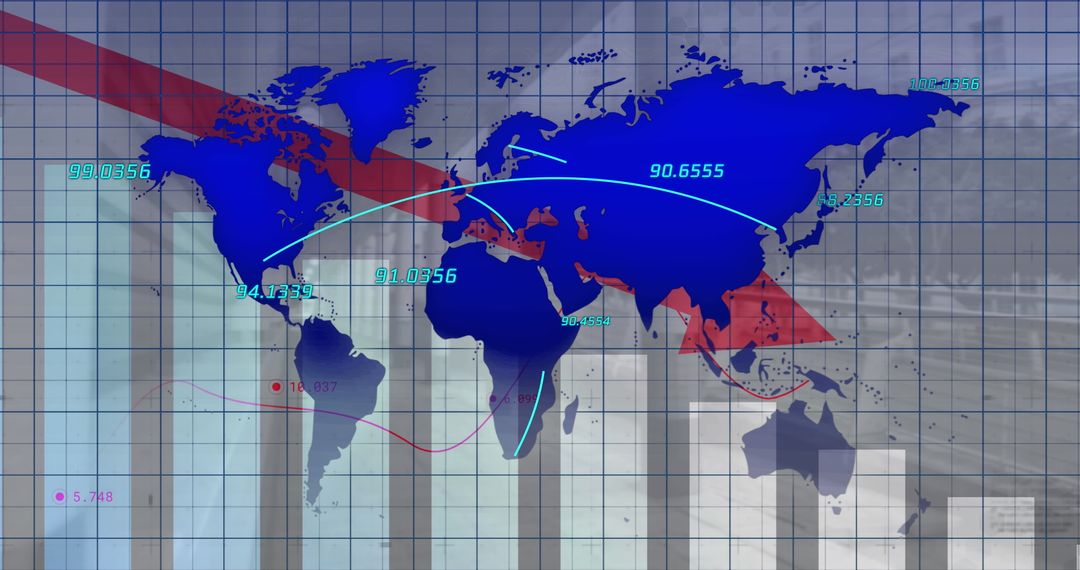
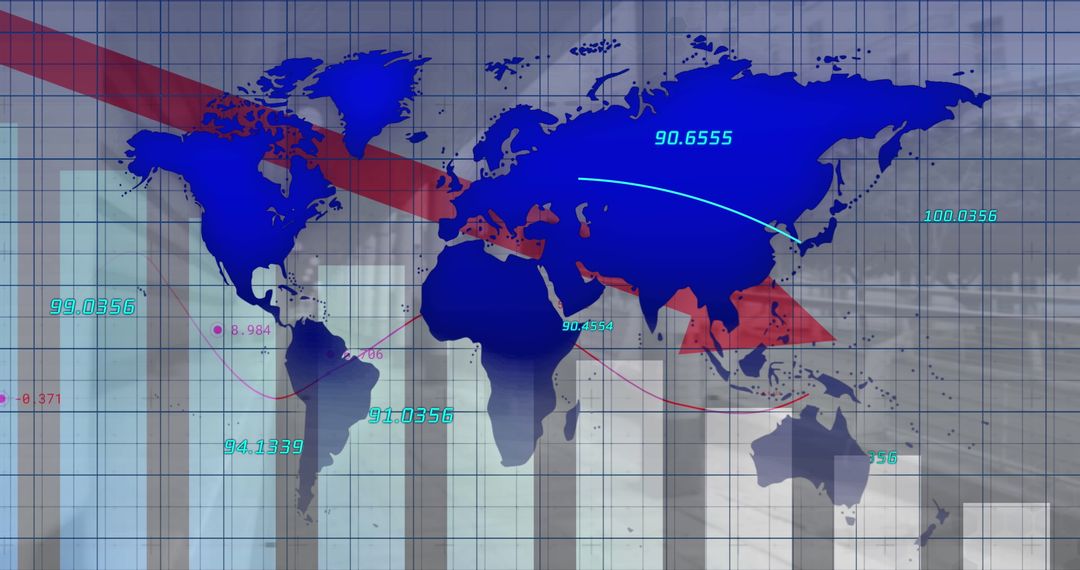
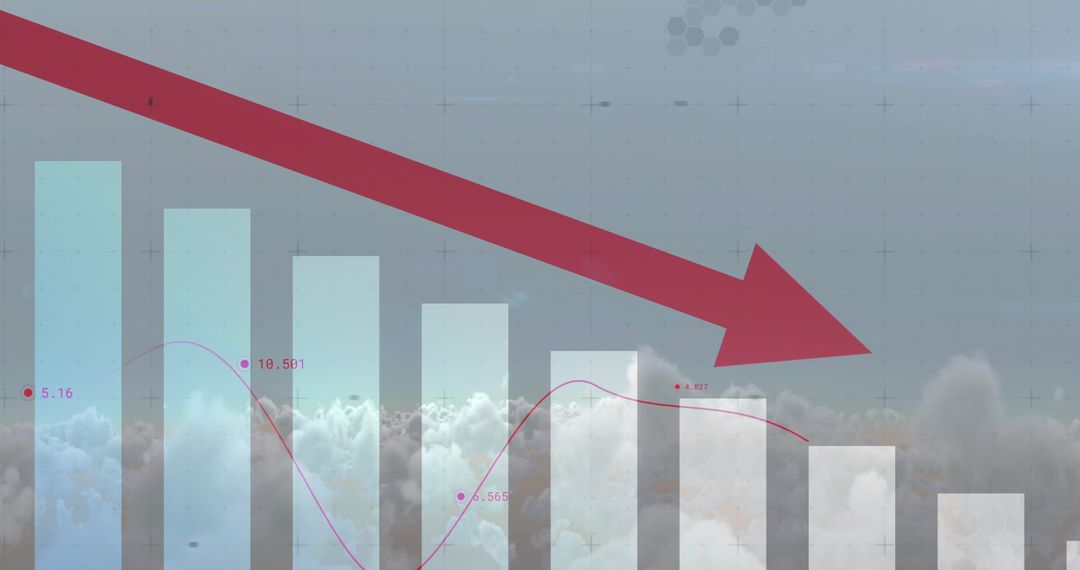
- Economic Downturn with Global Map and Descending Arrow
Economic Downturn with Global Map and Descending Arrow Image

Illustrates global economic decline with a world map and a descending arrow overlay. Ideal for representing financial losses, international market downturns, data analysis, and global trade impacts in reports, presentations, or articles focusing on economic trends.
Powered by  - Get 15% off with code: PIKWIZARD15


2
downloads
downloads
Tags:
More
Credit Photo
If you would like to credit the Photo, here are some ways you can do so
Text Link
photo Link
<span class="text-link">
<span>
<a target="_blank" href=https://pikwizard.com/photo/economic-downturn-with-global-map-and-descending-arrow/a110926c191919ae51c71c0abace945b/>PikWizard</a>
</span>
</span>
<span class="image-link">
<span
style="margin: 0 0 20px 0; display: inline-block; vertical-align: middle; width: 100%;"
>
<a
target="_blank"
href="https://pikwizard.com/photo/economic-downturn-with-global-map-and-descending-arrow/a110926c191919ae51c71c0abace945b/"
style="text-decoration: none; font-size: 10px; margin: 0;"
>
<img src="https://pikwizard.com/pw/medium/a110926c191919ae51c71c0abace945b.jpg" style="margin: 0; width: 100%;" alt="" />
<p style="font-size: 12px; margin: 0;">PikWizard</p>
</a>
</span>
</span>
Free (free of charge)
Free for personal and commercial use.
Author: People Creations
Similar Free Stock Images

Premium


Premium


Premium


Premium


Premium


Premium


Premium


Premium


Premium


Premium


Premium


Premium


Premium


Premium


Premium


Premium


Premium


Premium


Premium


Premium


Premium


Premium


Premium


Premium

