- Home >
- Stock Photos >
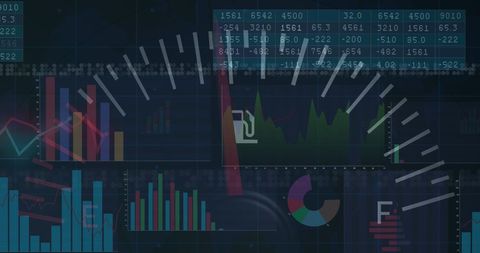
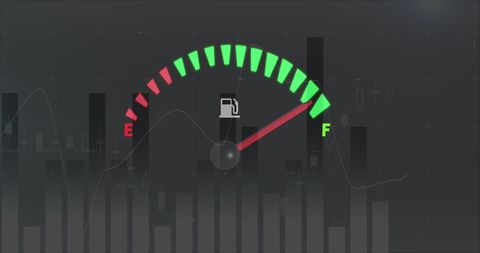
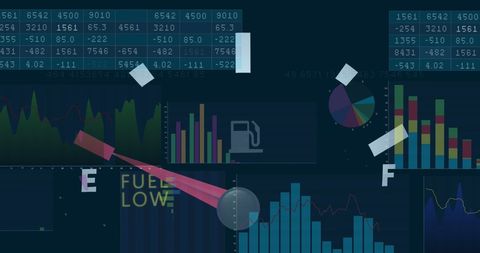
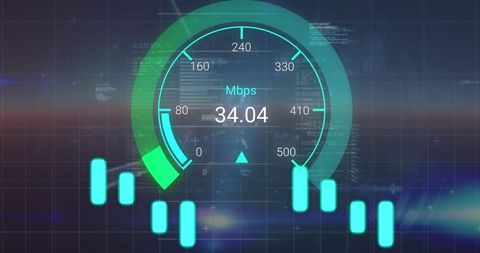
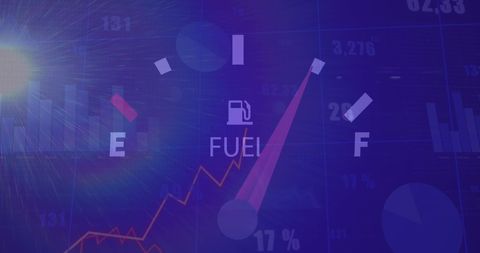
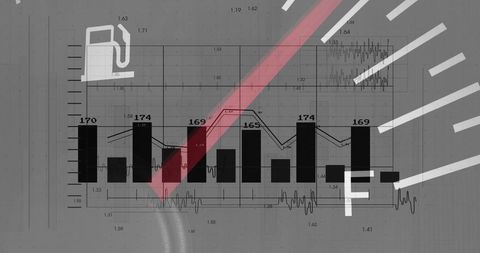
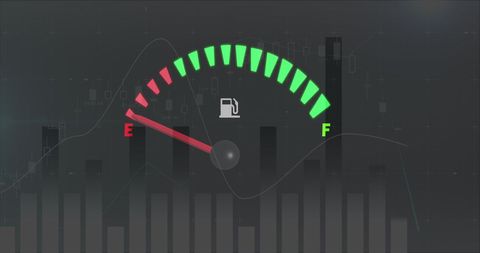
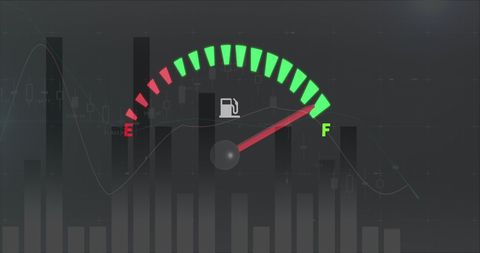
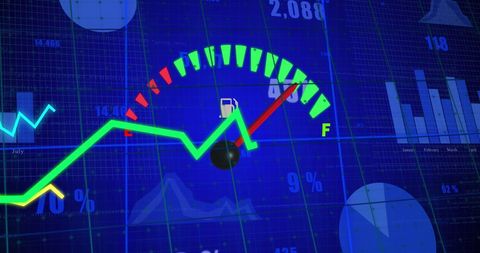
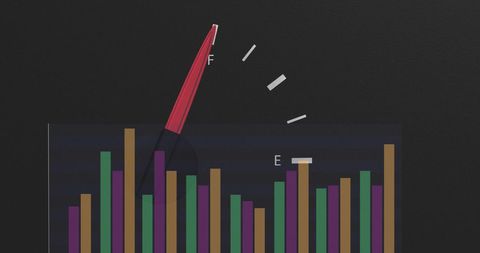
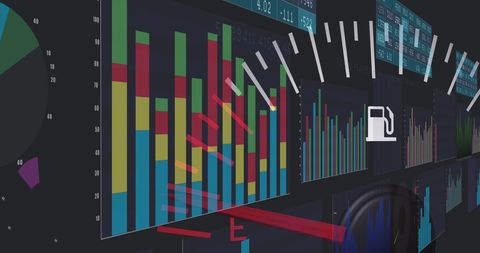
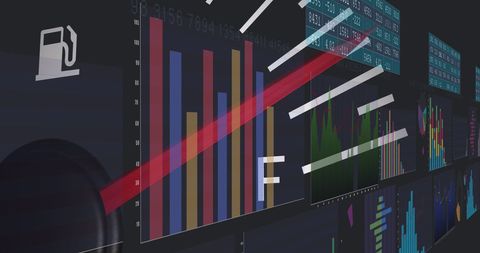
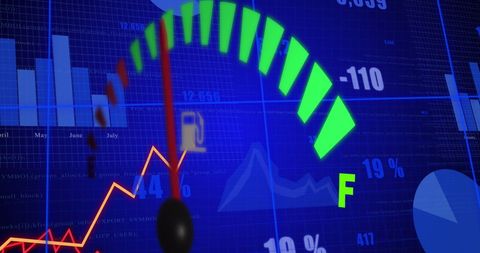
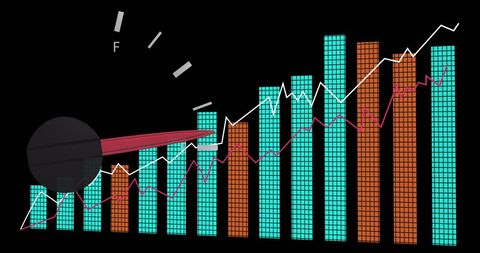
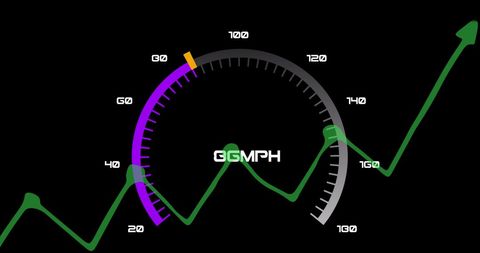
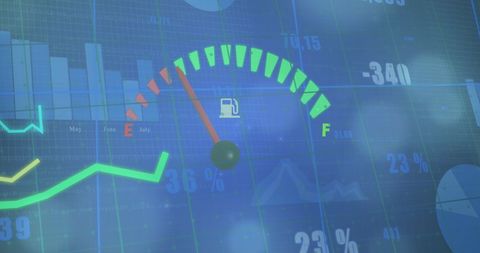
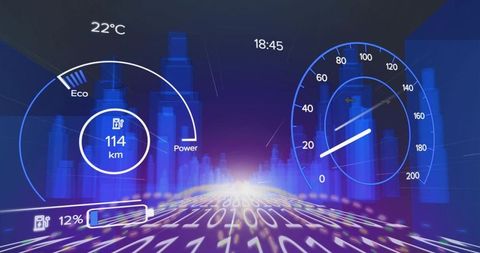
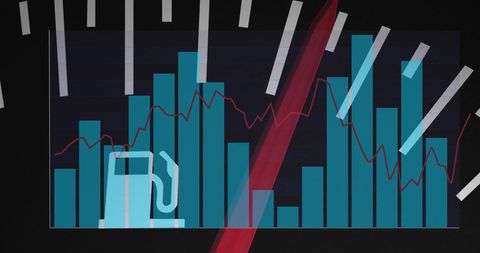
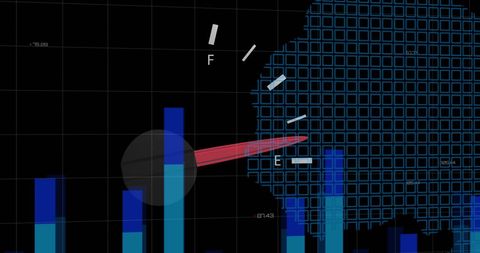
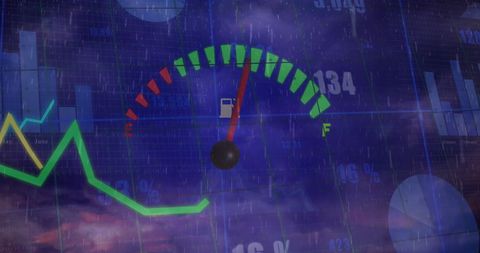
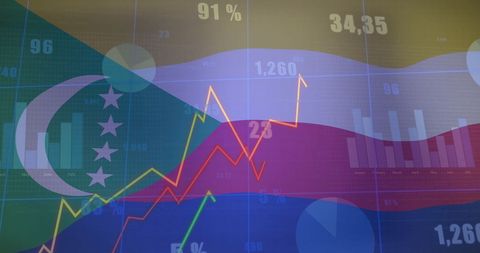
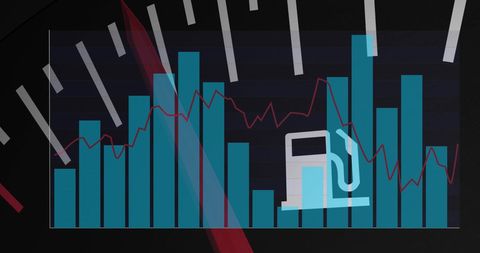
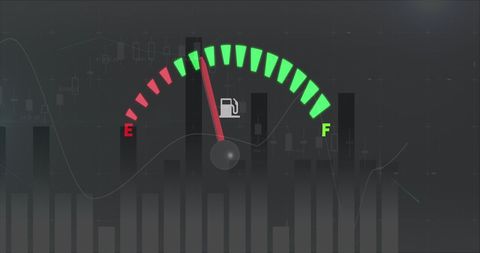
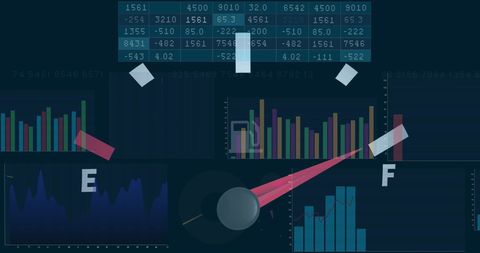
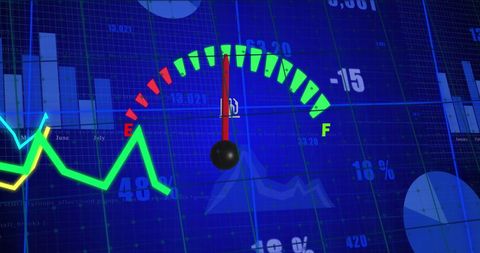
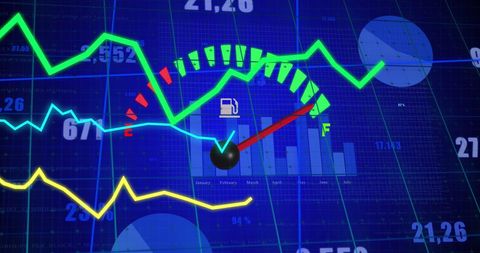
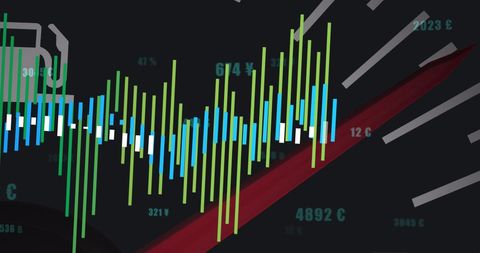
- Economic Growth Illustrated by Digital Interface and Dashboard Indicators
Economic Growth Illustrated by Digital Interface and Dashboard Indicators Image
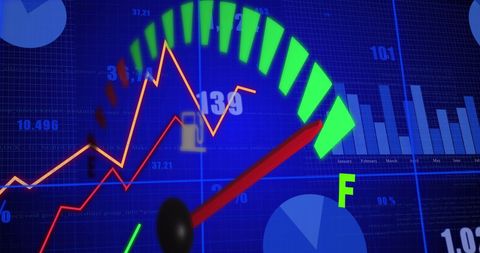
Dynamic representation of economic data integrating digital interfaces and car dashboard motifs. Useful for illustrating economic trends, digital finance solutions, analytic tools, and business performance enhancements.
Powered by 


2
downloads
downloads
Tags:
More
Credit Photo
If you would like to credit the Photo, here are some ways you can do so
Text Link
photo Link
<span class="text-link">
<span>
<a target="_blank" href=https://pikwizard.com/photo/economic-growth-illustrated-by-digital-interface-and-dashboard-indicators/aa6aee7df8cd63e00993194d16449565/>PikWizard</a>
</span>
</span>
<span class="image-link">
<span
style="margin: 0 0 20px 0; display: inline-block; vertical-align: middle; width: 100%;"
>
<a
target="_blank"
href="https://pikwizard.com/photo/economic-growth-illustrated-by-digital-interface-and-dashboard-indicators/aa6aee7df8cd63e00993194d16449565/"
style="text-decoration: none; font-size: 10px; margin: 0;"
>
<img src="https://pikwizard.com/pw/medium/aa6aee7df8cd63e00993194d16449565.jpg" style="margin: 0; width: 100%;" alt="" />
<p style="font-size: 12px; margin: 0;">PikWizard</p>
</a>
</span>
</span>
Free (free of charge)
Free for personal and commercial use.
Author: Creative Art
Similar Free Stock Images
Loading...

Premium

Premium

Premium


Premium


Premium


Premium


Premium


Premium

Premium


Premium


Premium

Premium


Premium


Premium

Premium

Premium


Premium


Premium


Premium


Premium


Premium

Premium

Premium


Premium


Premium