
- Home >
- Stock Photos >
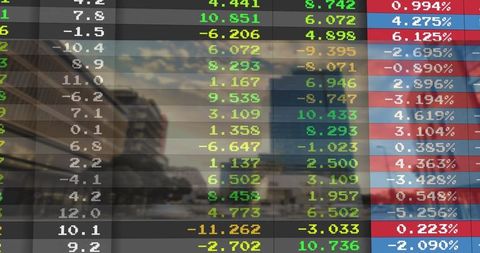
- Economic Growth Virtual Data Interface and Analytics Visual
Economic Growth Virtual Data Interface and Analytics Visual Image

Displays numerous financial statistics over a digital grid, making it ideal for illustrating concepts of market trends, investment analysis, and comprehensive data examination. Useful for presentations or websites focusing on business growth and financial reporting.
Powered by  - Get 15% off with code: PIKWIZARD15


downloads
Tags:
More
Credit Photo
If you would like to credit the Photo, here are some ways you can do so
Text Link
photo Link
<span class="text-link">
<span>
<a target="_blank" href=https://pikwizard.com/photo/economic-growth-virtual-data-interface-and-analytics-visual/aca680cc51f27e5072b0627bede17033/>PikWizard</a>
</span>
</span>
<span class="image-link">
<span
style="margin: 0 0 20px 0; display: inline-block; vertical-align: middle; width: 100%;"
>
<a
target="_blank"
href="https://pikwizard.com/photo/economic-growth-virtual-data-interface-and-analytics-visual/aca680cc51f27e5072b0627bede17033/"
style="text-decoration: none; font-size: 10px; margin: 0;"
>
<img src="https://pikwizard.com/pw/medium/aca680cc51f27e5072b0627bede17033.jpg" style="margin: 0; width: 100%;" alt="" />
<p style="font-size: 12px; margin: 0;">PikWizard</p>
</a>
</span>
</span>
Free (free of charge)
Free for personal and commercial use.
Author: Authentic Images
Similar Free Stock Images

Premium


Premium


Premium


Premium


Premium


Premium


Premium


Premium


Premium


Premium


Premium


Premium

Premium

Premium


Premium


Premium

Premium


Premium


Premium


Premium

Premium


Premium


Premium


Premium


Premium


Explore More Free Stock Images