
- Home >
- Stock Photos >
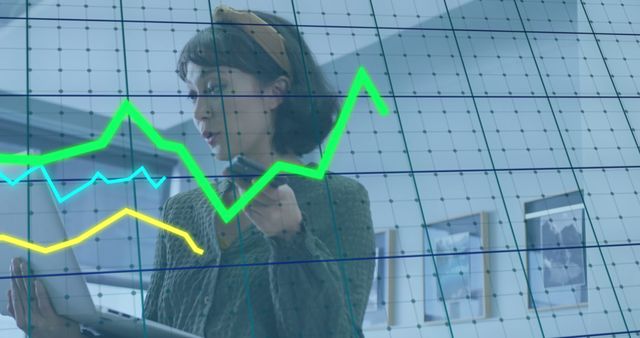
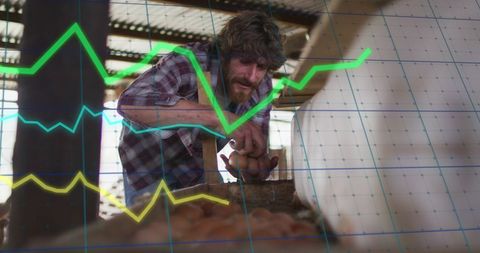
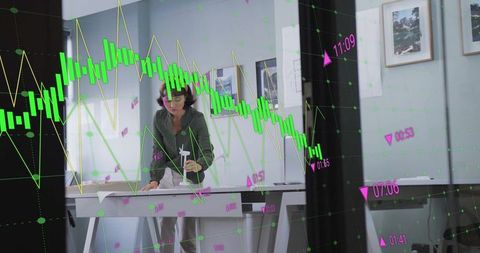
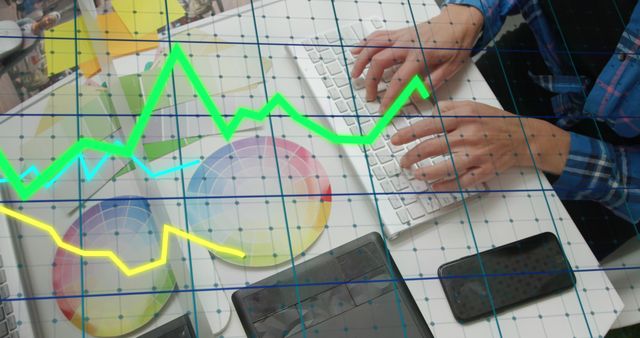
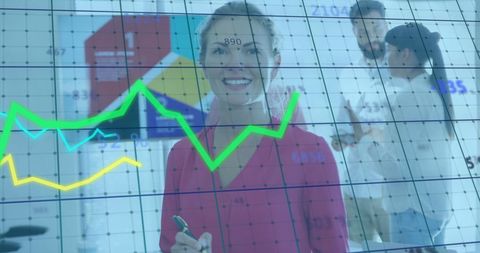
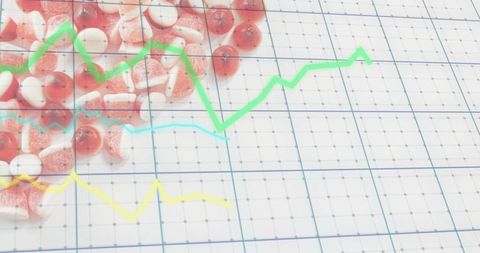
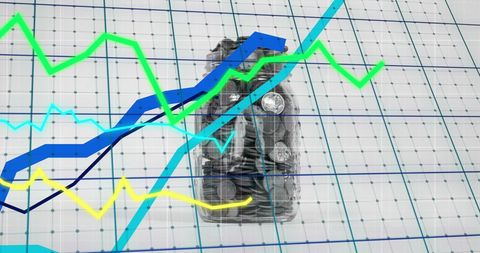
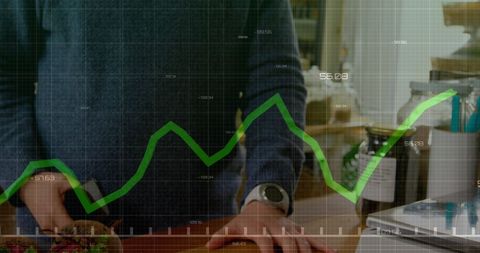
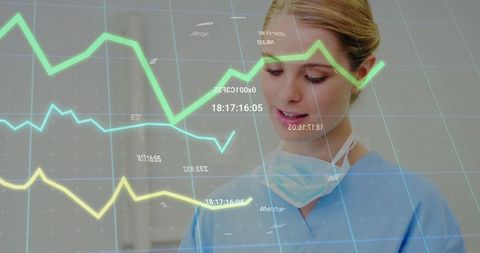
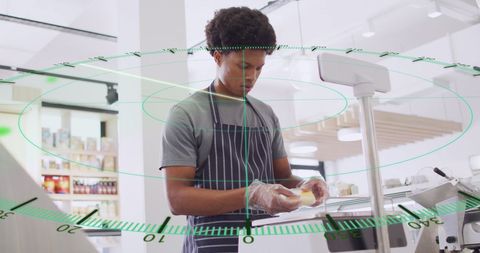
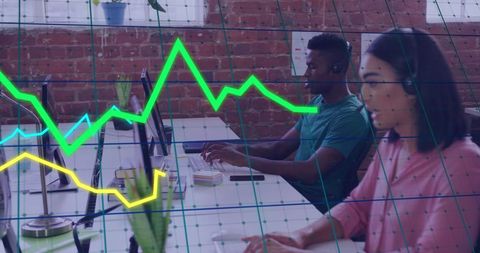
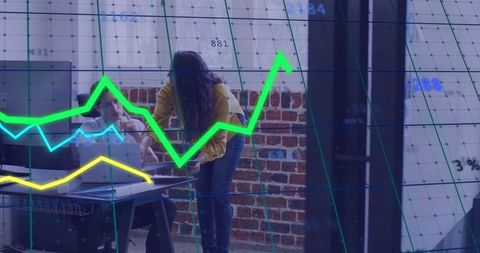
- Economic Growth with Data Interface and Financial Analysis
Economic Growth with Data Interface and Financial Analysis Image
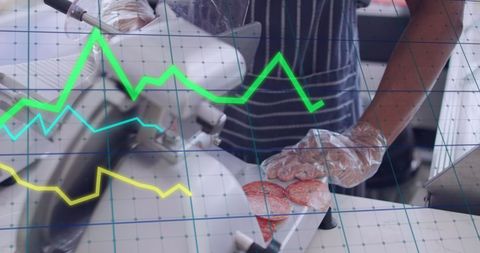
Graphic illustration overlay on shop environment, showcasing financial growth or data analysis concept. Useful for presentations on economic development, market trends, or retail technology integration.
Powered by  - Get 15% off with code: PIKWIZARD15


downloads
Tags:
More
Credit Photo
If you would like to credit the Photo, here are some ways you can do so
Text Link
photo Link
<span class="text-link">
<span>
<a target="_blank" href=https://pikwizard.com/photo/economic-growth-with-data-interface-and-financial-analysis/95fb972124242346de3b116ee5194f1b/>PikWizard</a>
</span>
</span>
<span class="image-link">
<span
style="margin: 0 0 20px 0; display: inline-block; vertical-align: middle; width: 100%;"
>
<a
target="_blank"
href="https://pikwizard.com/photo/economic-growth-with-data-interface-and-financial-analysis/95fb972124242346de3b116ee5194f1b/"
style="text-decoration: none; font-size: 10px; margin: 0;"
>
<img src="https://pikwizard.com/pw/medium/95fb972124242346de3b116ee5194f1b.jpg" style="margin: 0; width: 100%;" alt="" />
<p style="font-size: 12px; margin: 0;">PikWizard</p>
</a>
</span>
</span>
Free (free of charge)
Free for personal and commercial use.
Author: People Creations
Similar Free Stock Images
Loading...

Premium


Premium

Premium


Premium


Premium

Premium

Premium


Premium


Premium


Premium

Premium


Premium


Premium


Premium

Premium


Premium


Premium


Premium


Premium


Premium


Premium

Premium


Premium


Premium


Premium
