
- Home >
- Stock Photos >
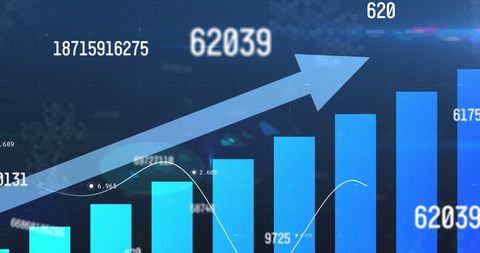
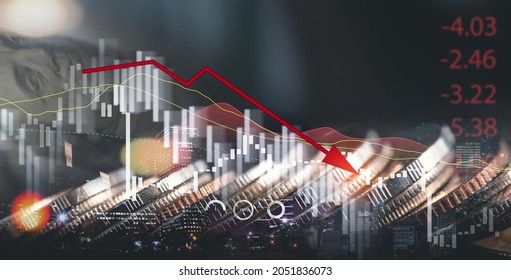
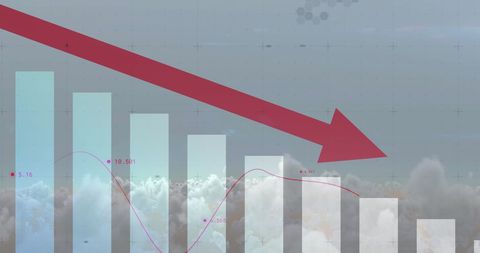
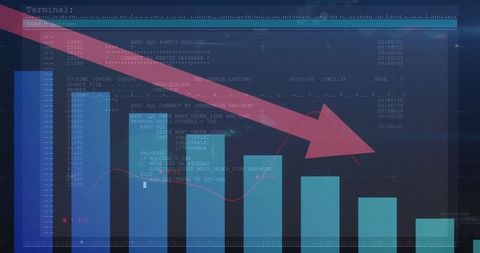
- Economic Inflation Trends with Rising Data Graph Representation
Economic Inflation Trends with Rising Data Graph Representation Image

Digital design highlighting inflation trends features a vibrant arrow and data graph, ideal for illustrating economic concepts. Suitable for use in financial reports, investment presentations, and economic blogs to demonstrate macroeconomic analyses and increasing market trends.
Powered by  - Get 15% off with code: PIKWIZARD15


2
downloads
downloads
Tags:
More
Credit Photo
If you would like to credit the Photo, here are some ways you can do so
Text Link
photo Link
<span class="text-link">
<span>
<a target="_blank" href=https://pikwizard.com/photo/economic-inflation-trends-with-rising-data-graph-representation/3c884fb90e4d22168d3174dc86497198/>PikWizard</a>
</span>
</span>
<span class="image-link">
<span
style="margin: 0 0 20px 0; display: inline-block; vertical-align: middle; width: 100%;"
>
<a
target="_blank"
href="https://pikwizard.com/photo/economic-inflation-trends-with-rising-data-graph-representation/3c884fb90e4d22168d3174dc86497198/"
style="text-decoration: none; font-size: 10px; margin: 0;"
>
<img src="https://pikwizard.com/pw/medium/3c884fb90e4d22168d3174dc86497198.jpg" style="margin: 0; width: 100%;" alt="" />
<p style="font-size: 12px; margin: 0;">PikWizard</p>
</a>
</span>
</span>
Free (free of charge)
Free for personal and commercial use.
Author: Authentic Images
Similar Free Stock Images

Premium


Premium


Premium


Premium


Premium


Premium


Premium


Premium


Premium


Premium


Premium


Premium


Premium


Premium


Premium


Premium


Premium


Premium


Premium


Premium


Premium


Premium


Premium


Premium


Premium

