
- Home >
- Stock Photos >
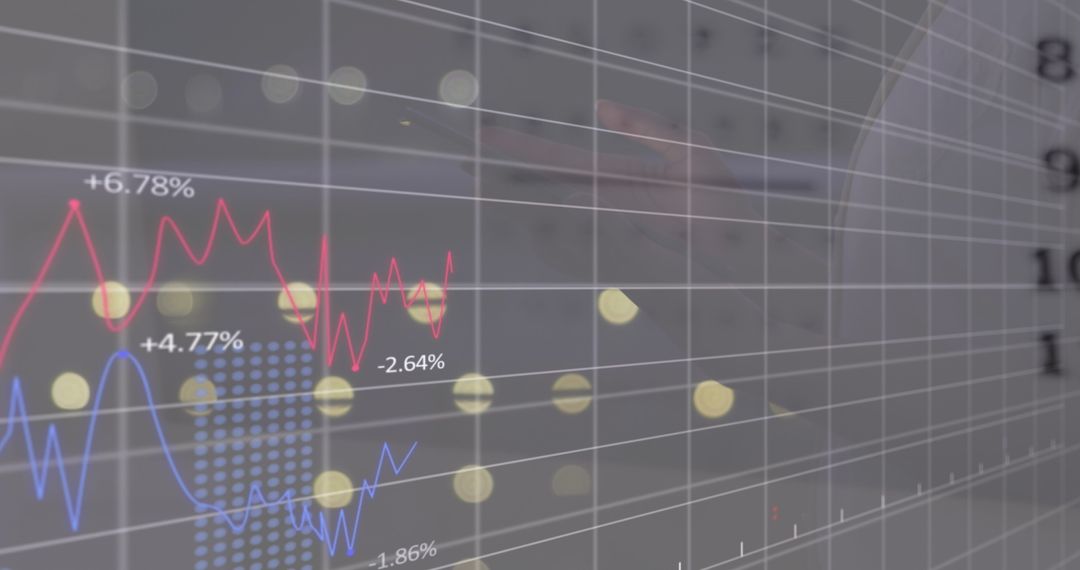
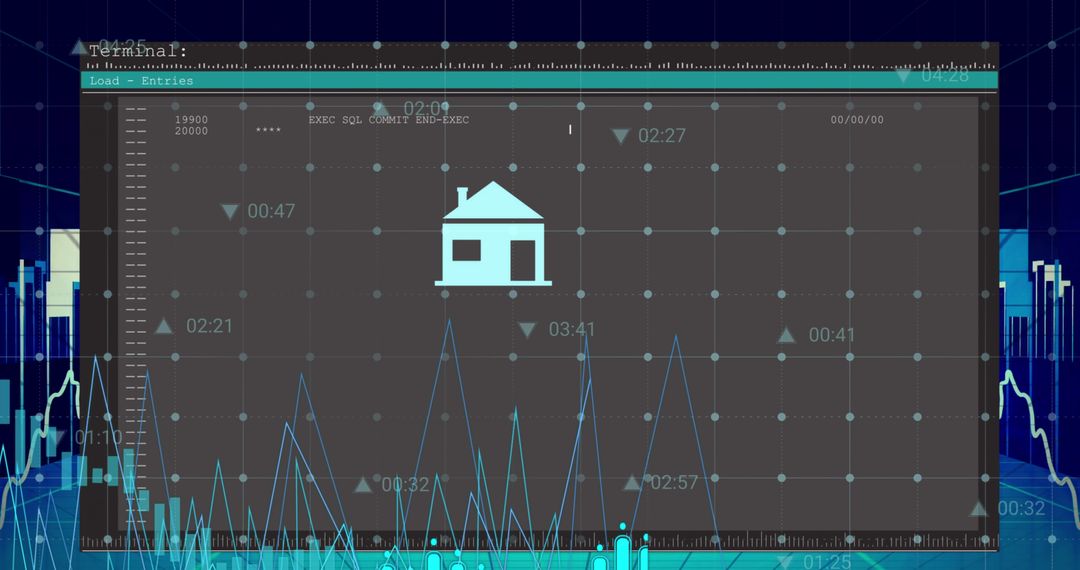
- Elevated Financial Growth Analysis Depicted with Modern 3D Graphics
Elevated Financial Growth Analysis Depicted with Modern 3D Graphics Image
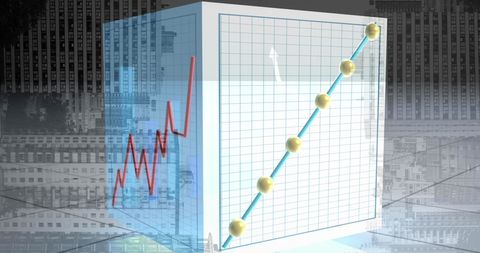
This visual effectively illustrates concepts of financial analytics and economic trends using advanced 3D graphics. Lines showcase rising data, representing growth and progress within global trade. Suitable for use in financial reports, market analysis studies, technology-driven economy presentations, and financial analytics workshops. Ideal for themes related to finance-oriented newsletters or digital media content focusing on economic innovation.
Powered by  - Get 15% off with code: PIKWIZARD15


2
downloads
downloads
Tags:
More
Credit Photo
If you would like to credit the Photo, here are some ways you can do so
Text Link
photo Link
<span class="text-link">
<span>
<a target="_blank" href=https://pikwizard.com/photo/elevated-financial-growth-analysis-depicted-with-modern-3d-graphics/1054bd95d659fb8287668edc8d543aca/>PikWizard</a>
</span>
</span>
<span class="image-link">
<span
style="margin: 0 0 20px 0; display: inline-block; vertical-align: middle; width: 100%;"
>
<a
target="_blank"
href="https://pikwizard.com/photo/elevated-financial-growth-analysis-depicted-with-modern-3d-graphics/1054bd95d659fb8287668edc8d543aca/"
style="text-decoration: none; font-size: 10px; margin: 0;"
>
<img src="https://pikwizard.com/pw/medium/1054bd95d659fb8287668edc8d543aca.jpg" style="margin: 0; width: 100%;" alt="" />
<p style="font-size: 12px; margin: 0;">PikWizard</p>
</a>
</span>
</span>
Free (free of charge)
Free for personal and commercial use.
Author: People Creations
Similar Free Stock Images

Premium


Premium


Premium


Premium


Premium


Premium


Premium


Premium


Premium


Premium


Premium


Premium


Premium


Premium


Premium


Premium


Premium


Premium


Premium


Premium


Premium


Premium


Premium


Premium

