
- Home >
- Stock Photos >
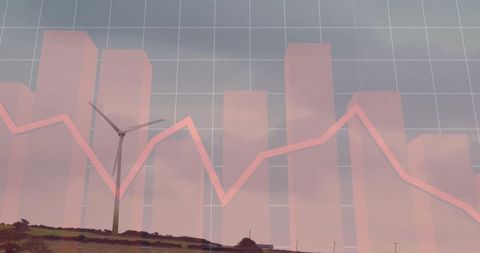
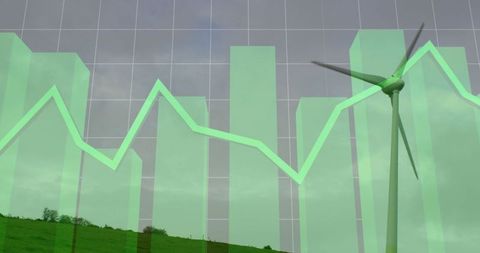
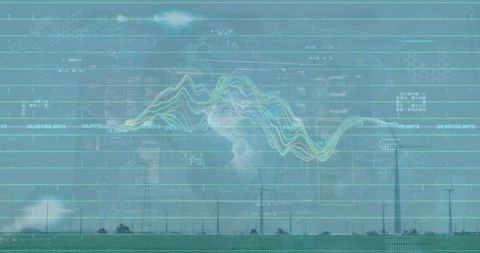
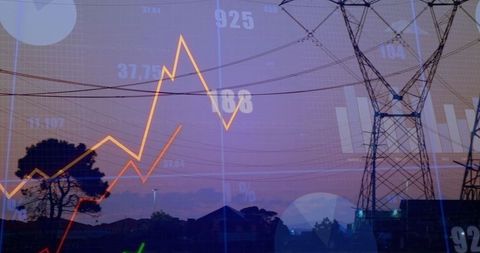
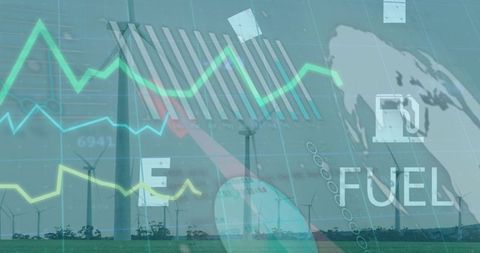
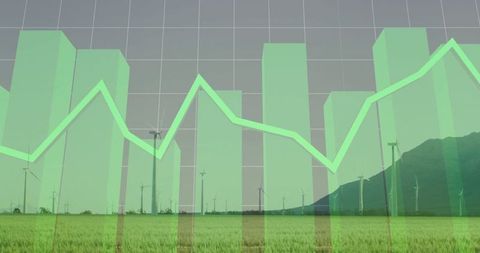
- Energy Analytics Over Rural Infrastructure with Data Visualization
Energy Analytics Over Rural Infrastructure with Data Visualization Image
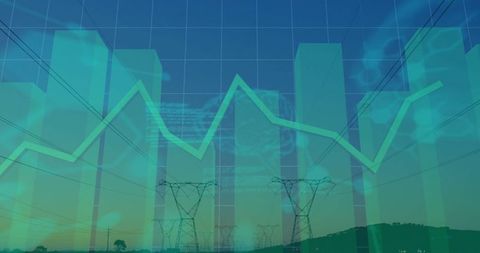
This visualization combines charts and graphs with an image of rural transmission towers, representing the analysis of energy data and infrastructure planning. Useful for demonstrations about sustainable energy development, presentations on technological advancements in power grid analytics, or as illustrative content in publications about rural infrastructure challenges.
Powered by 


downloads
Tags:
More
Credit Photo
If you would like to credit the Photo, here are some ways you can do so
Text Link
photo Link
<span class="text-link">
<span>
<a target="_blank" href=https://pikwizard.com/photo/energy-analytics-over-rural-infrastructure-with-data-visualization/9854a0a7ee81fef7c9735ab4376b3710/>PikWizard</a>
</span>
</span>
<span class="image-link">
<span
style="margin: 0 0 20px 0; display: inline-block; vertical-align: middle; width: 100%;"
>
<a
target="_blank"
href="https://pikwizard.com/photo/energy-analytics-over-rural-infrastructure-with-data-visualization/9854a0a7ee81fef7c9735ab4376b3710/"
style="text-decoration: none; font-size: 10px; margin: 0;"
>
<img src="https://pikwizard.com/pw/medium/9854a0a7ee81fef7c9735ab4376b3710.jpg" style="margin: 0; width: 100%;" alt="" />
<p style="font-size: 12px; margin: 0;">PikWizard</p>
</a>
</span>
</span>
Free (free of charge)
Free for personal and commercial use.
Author: Creative Art
Similar Free Stock Images

Premium


Premium

Premium

Premium

Premium


Premium


Premium


Premium


Premium


Premium


Premium


Premium


Premium


Premium


Premium


Premium


Premium


Premium


Premium

Premium
Premium


Premium


Premium


Premium

Premium


Explore More Free Stock Images