- Home >
- Stock Photos >
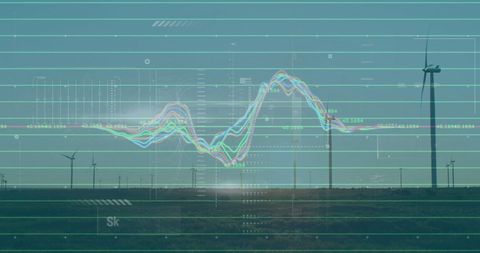
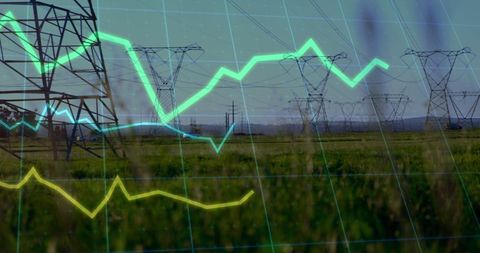
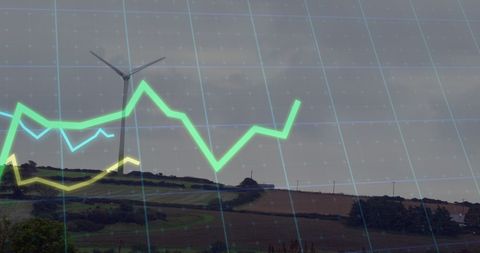
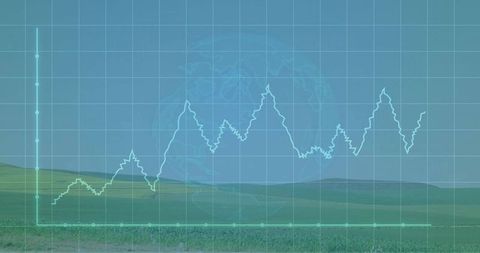
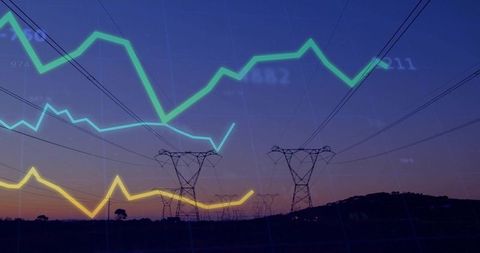
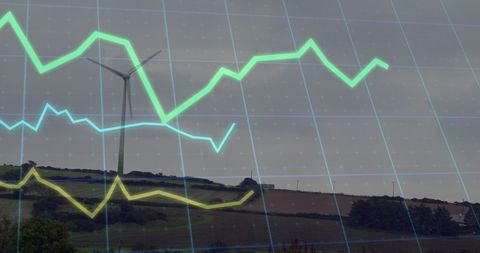
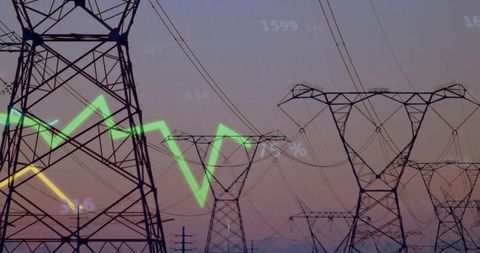
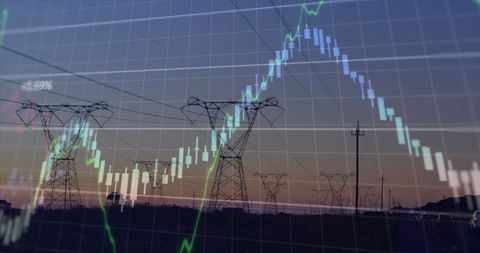
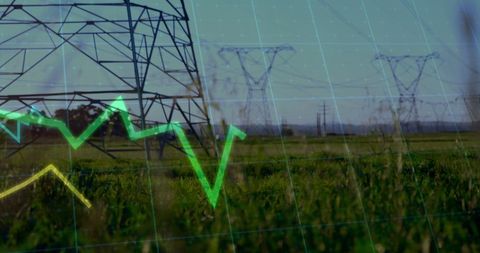
- Energy Efficiency with Data Analytics and Smart Infrastructure
Energy Efficiency with Data Analytics and Smart Infrastructure Image

Illustrates interaction between technology and electricity delivery for optimizing power resources. Relevant for projects on energy management, smart grid development, and infrastructural innovations. Suitable for presentations, articles, or reports focused on digital enhancement of utility services or energy conservation.

downloads
Tags:
More
Credit Photo
If you would like to credit the Photo, here are some ways you can do so
Text Link
photo Link
<span class="text-link">
<span>
<a target="_blank" href=https://pikwizard.com/photo/energy-efficiency-with-data-analytics-and-smart-infrastructure/5548efdf0351e6dabeee26e4f39307d6/>PikWizard</a>
</span>
</span>
<span class="image-link">
<span
style="margin: 0 0 20px 0; display: inline-block; vertical-align: middle; width: 100%;"
>
<a
target="_blank"
href="https://pikwizard.com/photo/energy-efficiency-with-data-analytics-and-smart-infrastructure/5548efdf0351e6dabeee26e4f39307d6/"
style="text-decoration: none; font-size: 10px; margin: 0;"
>
<img src="https://pikwizard.com/pw/medium/5548efdf0351e6dabeee26e4f39307d6.jpg" style="margin: 0; width: 100%;" alt="" />
<p style="font-size: 12px; margin: 0;">PikWizard</p>
</a>
</span>
</span>
Free (free of charge)
Free for personal and commercial use.
Author: Creative Art