- Home >
- Stock Photos >
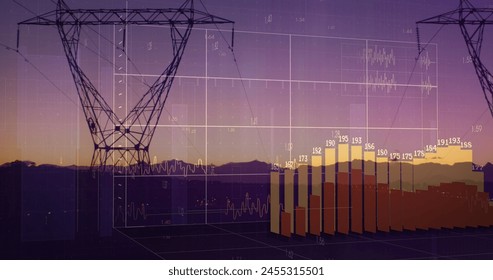
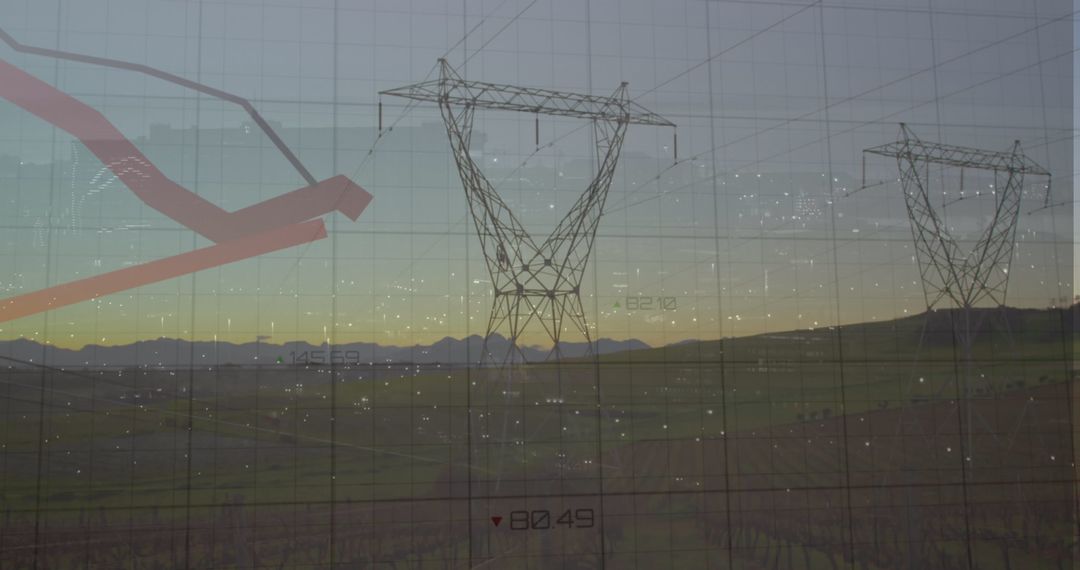
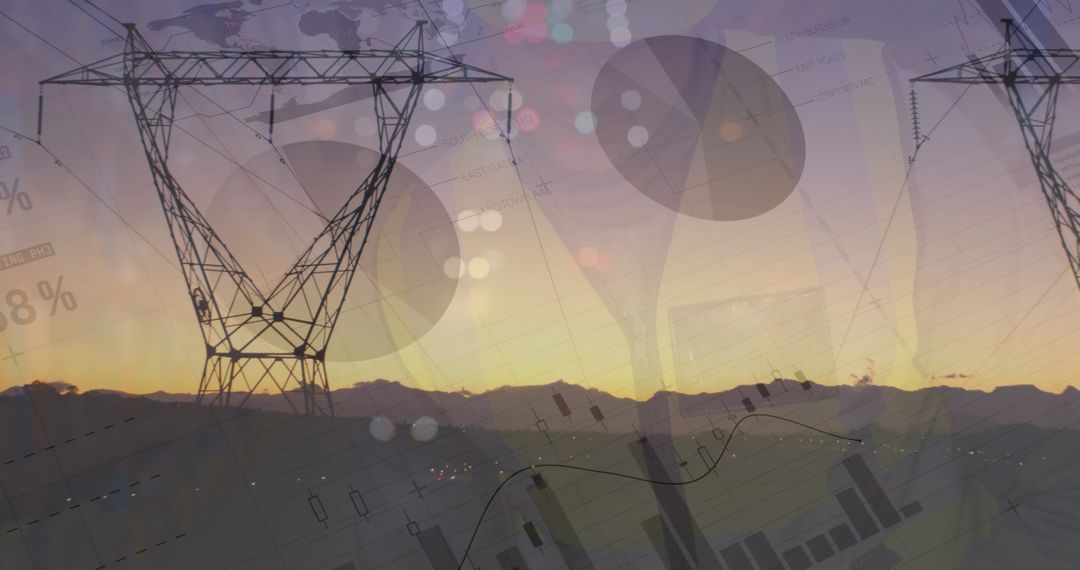
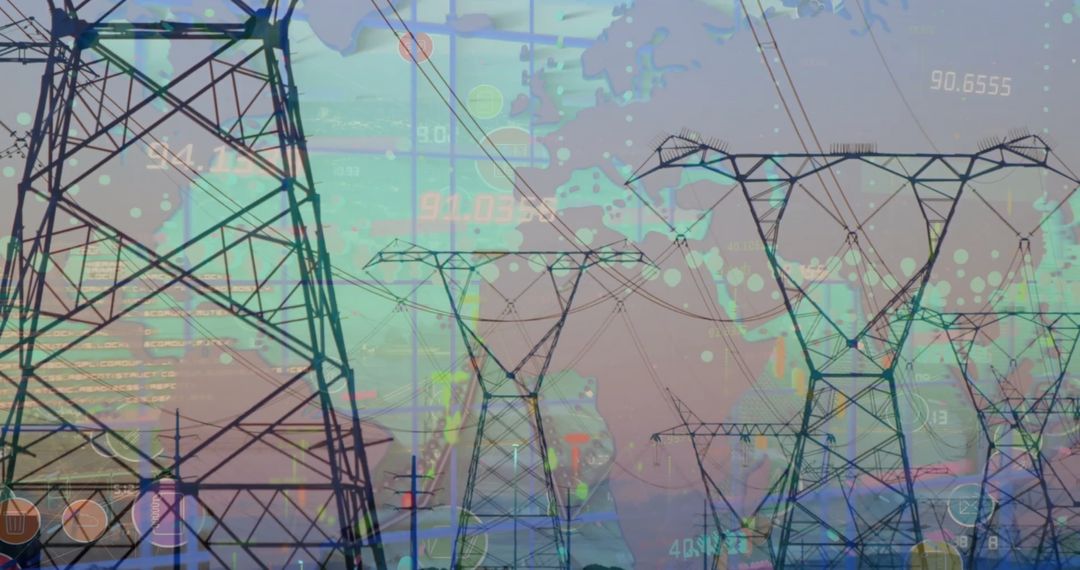
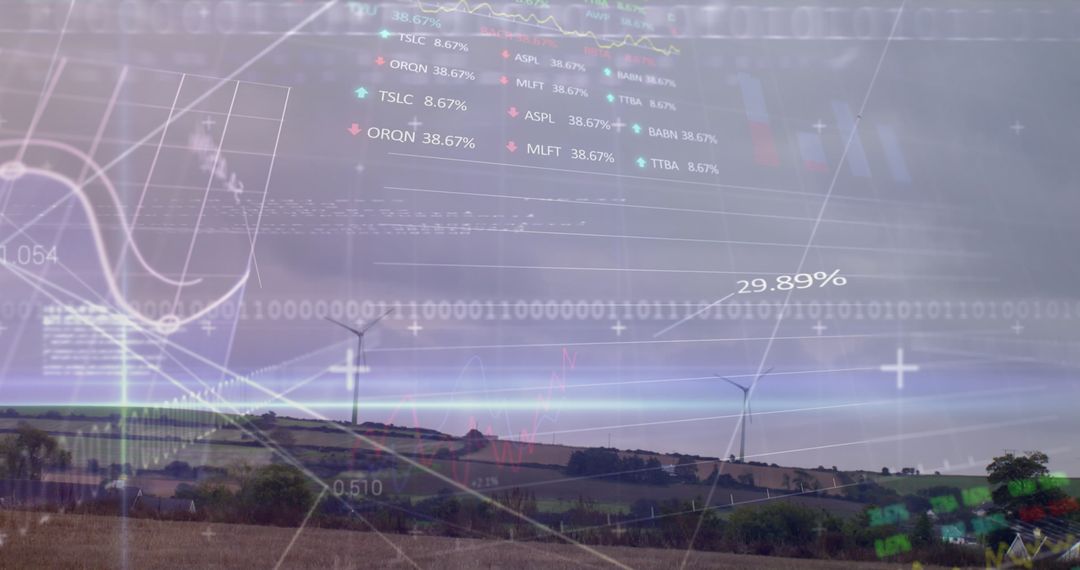
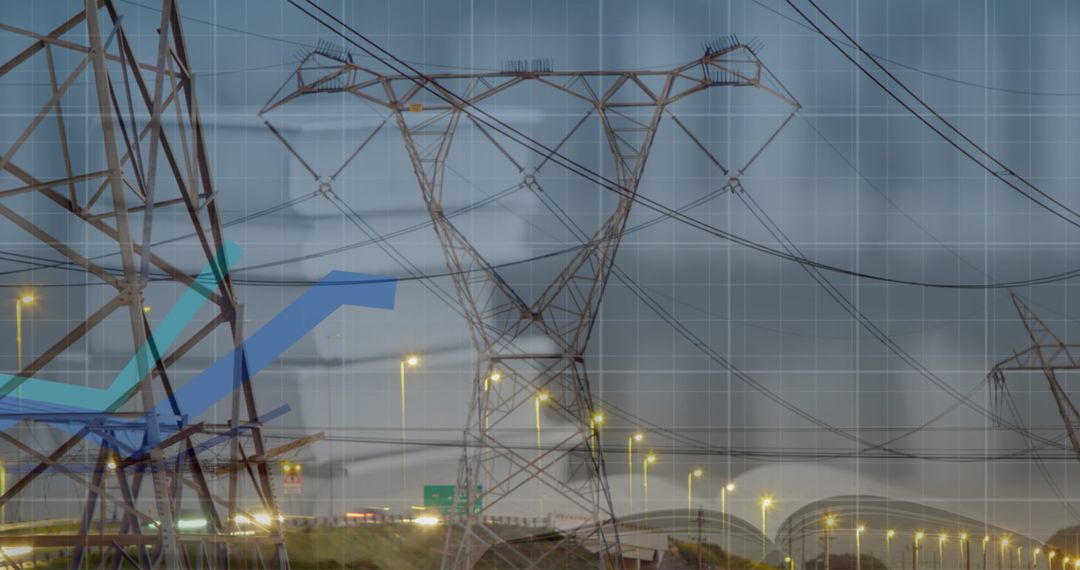
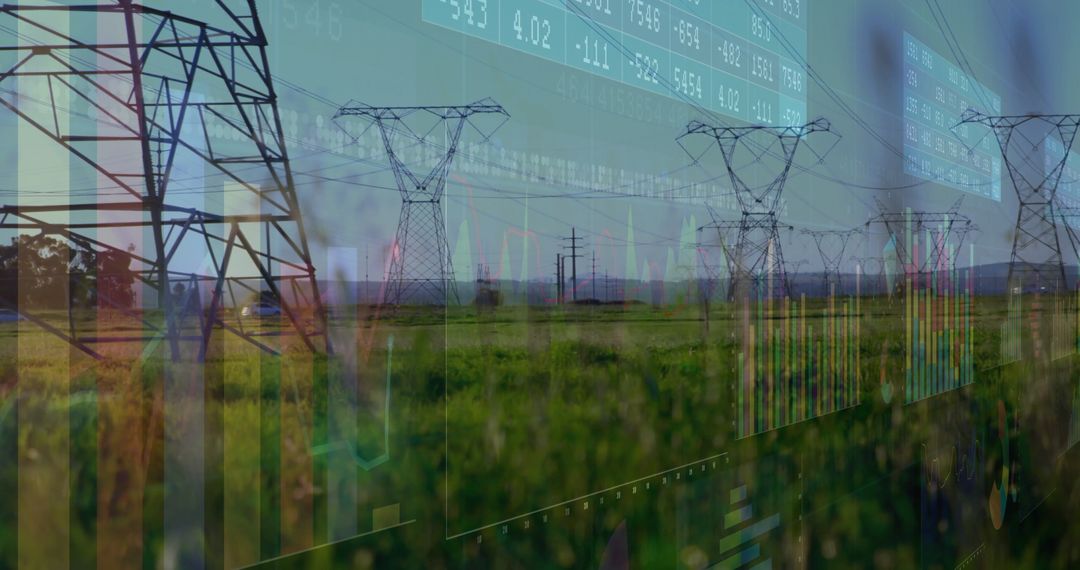
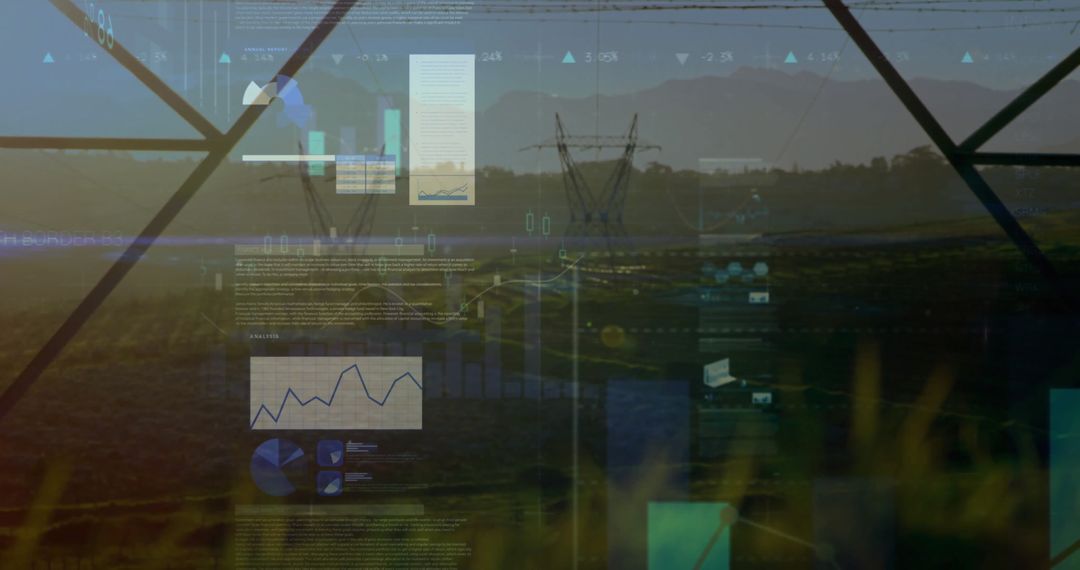
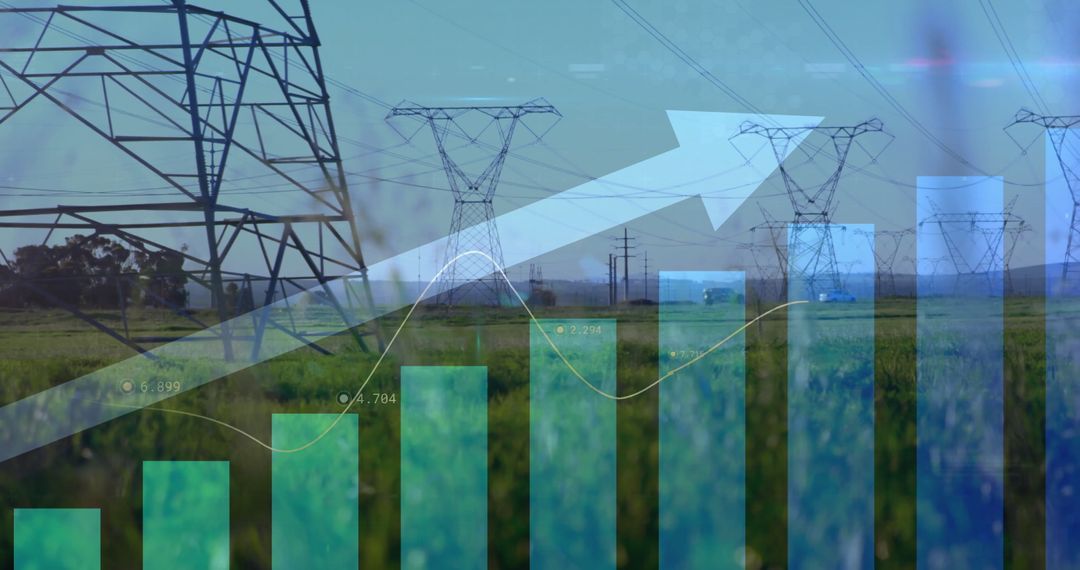
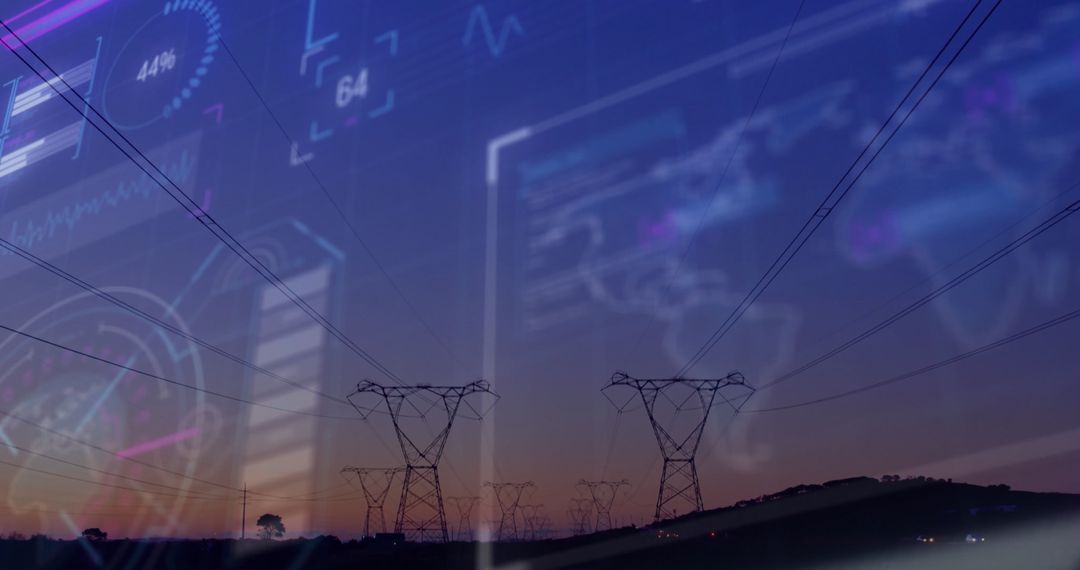
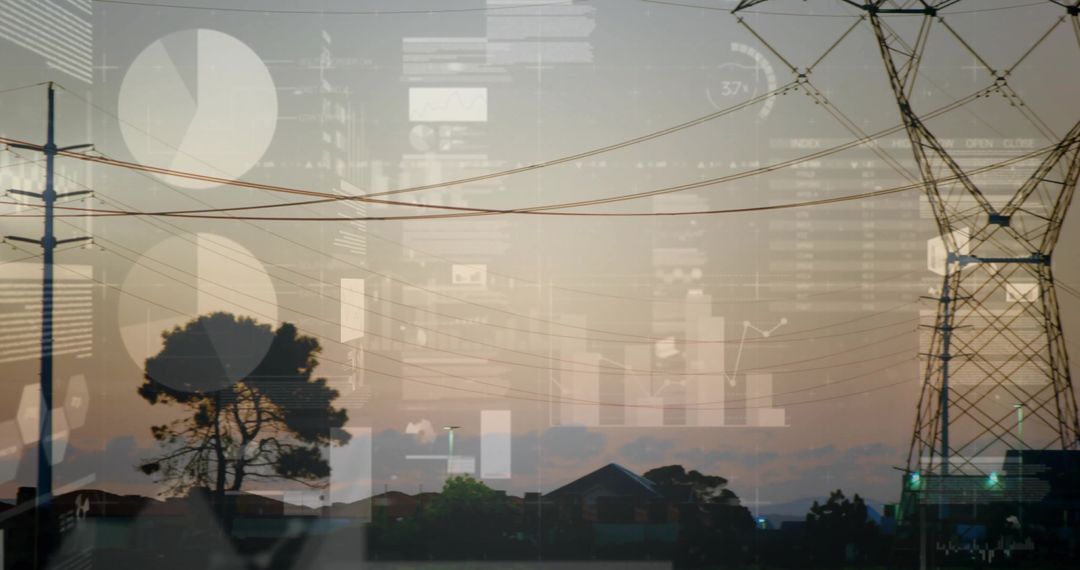
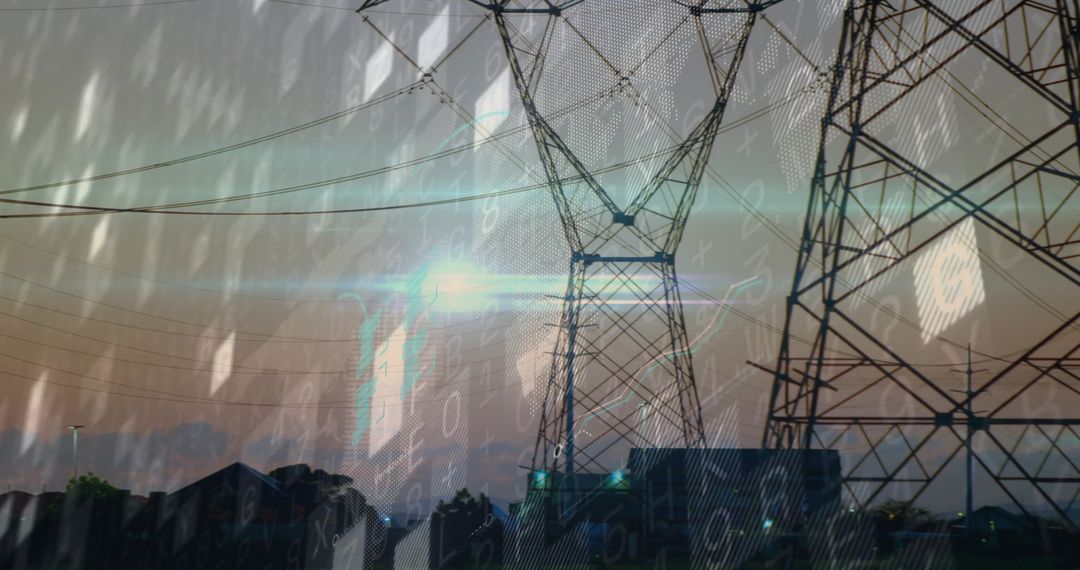
- Energy Market and Financial Data Integration Visualization
Energy Market and Financial Data Integration Visualization Image
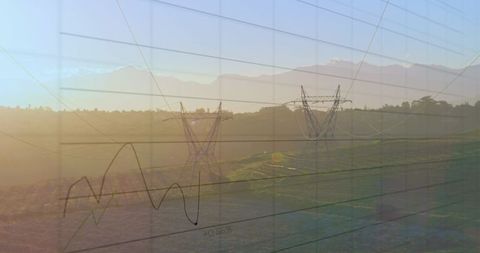
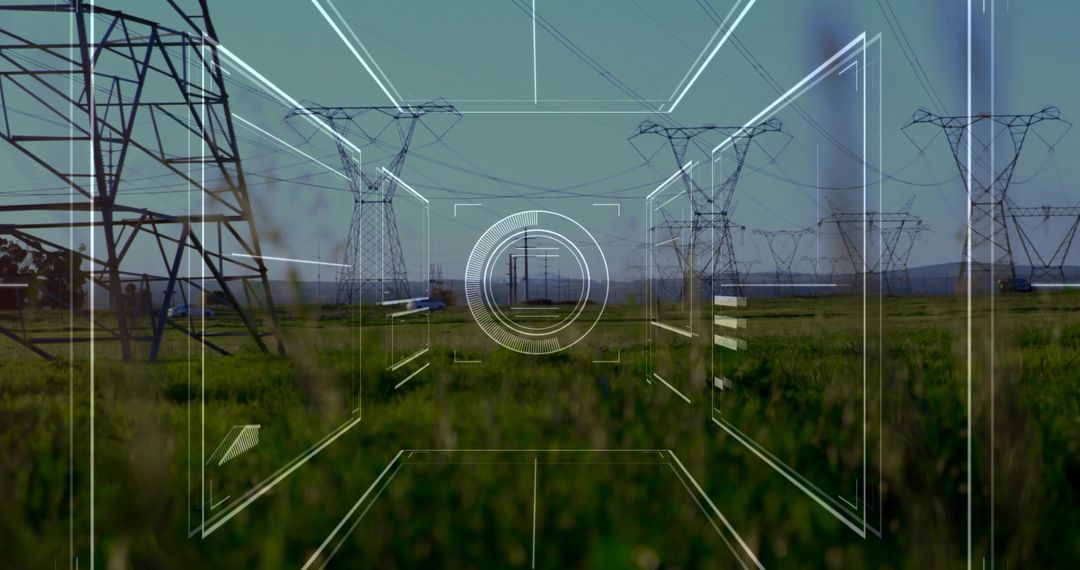
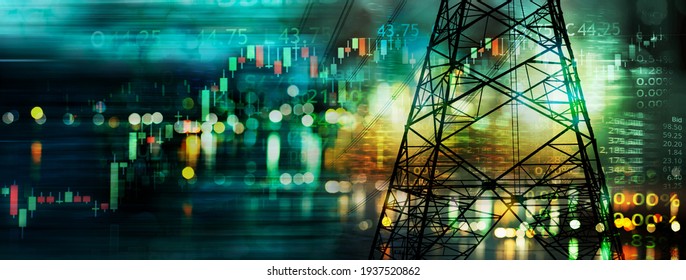
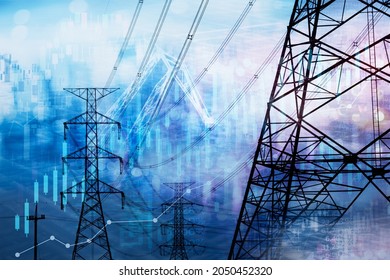
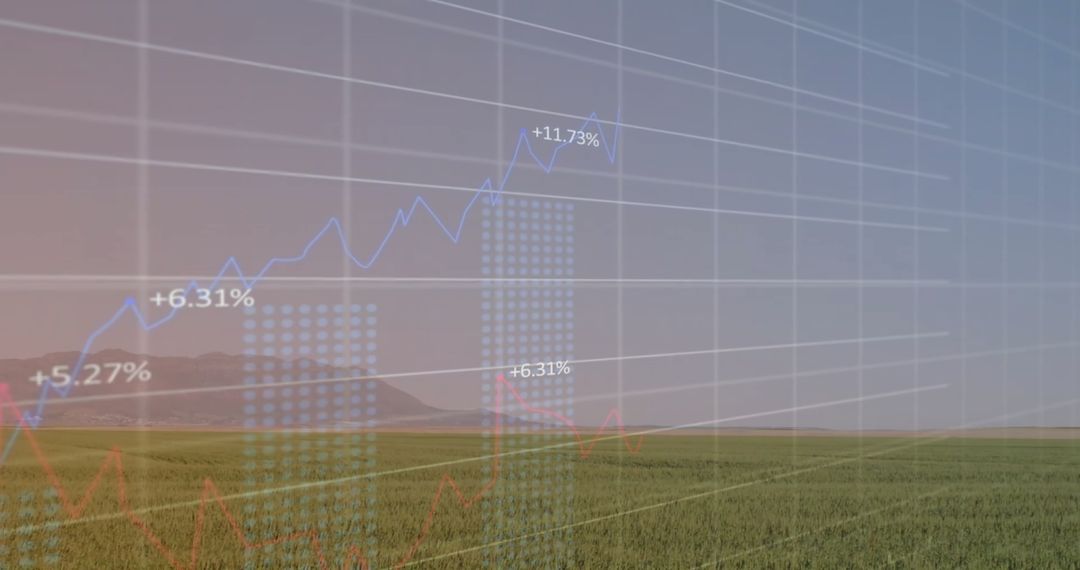
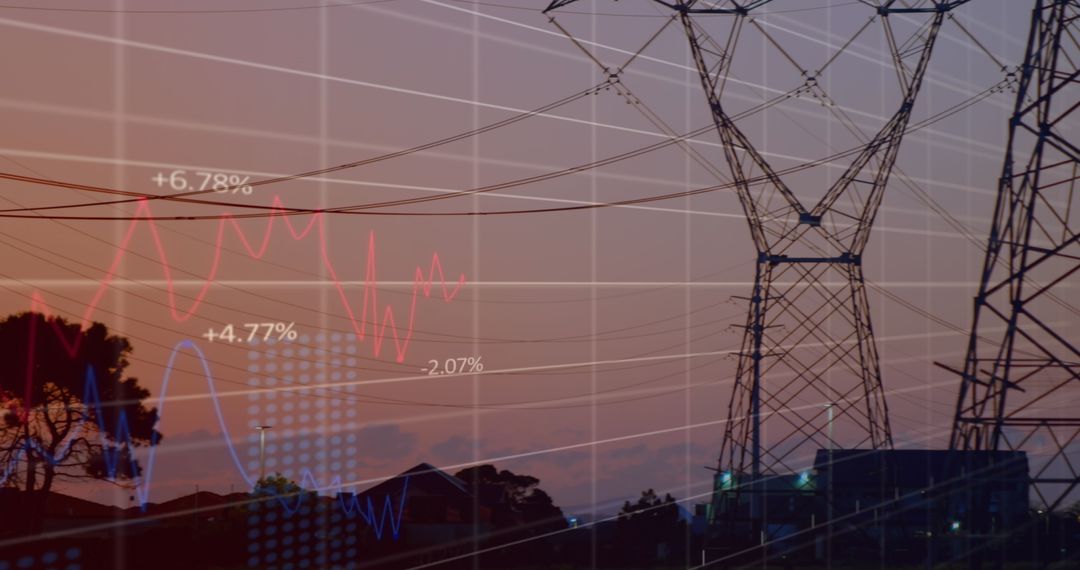
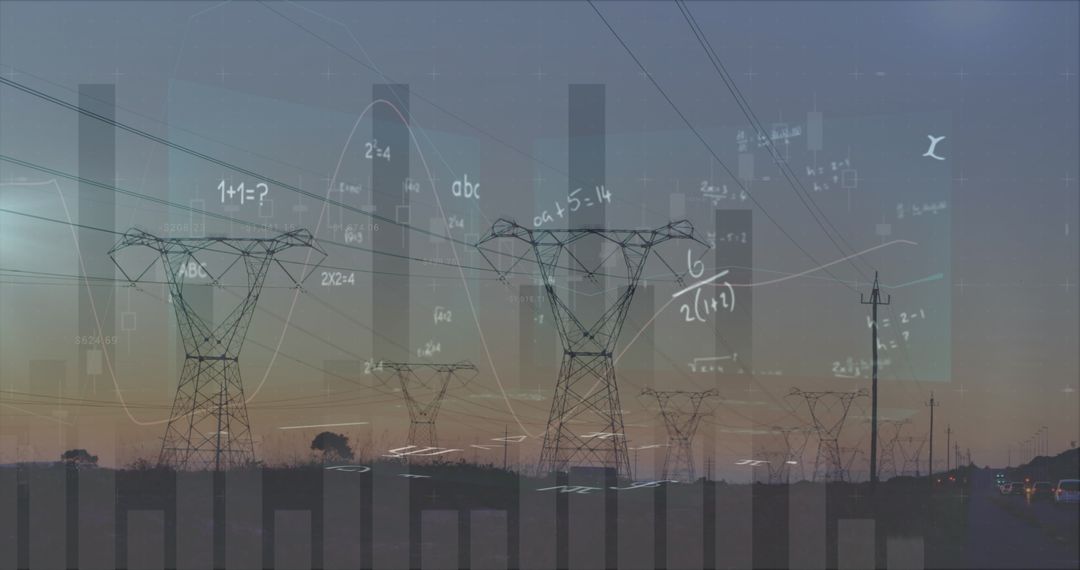
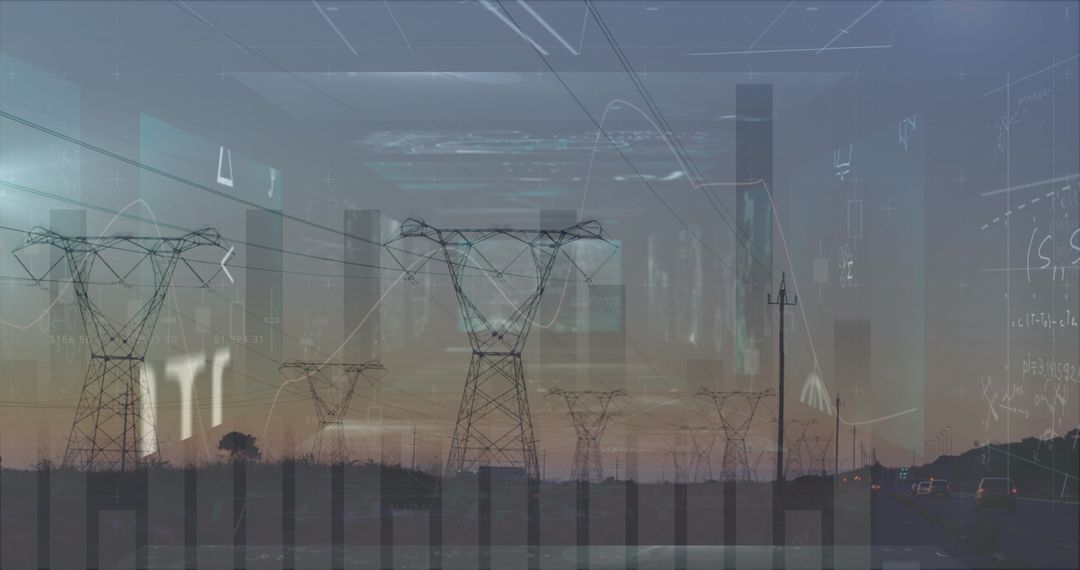
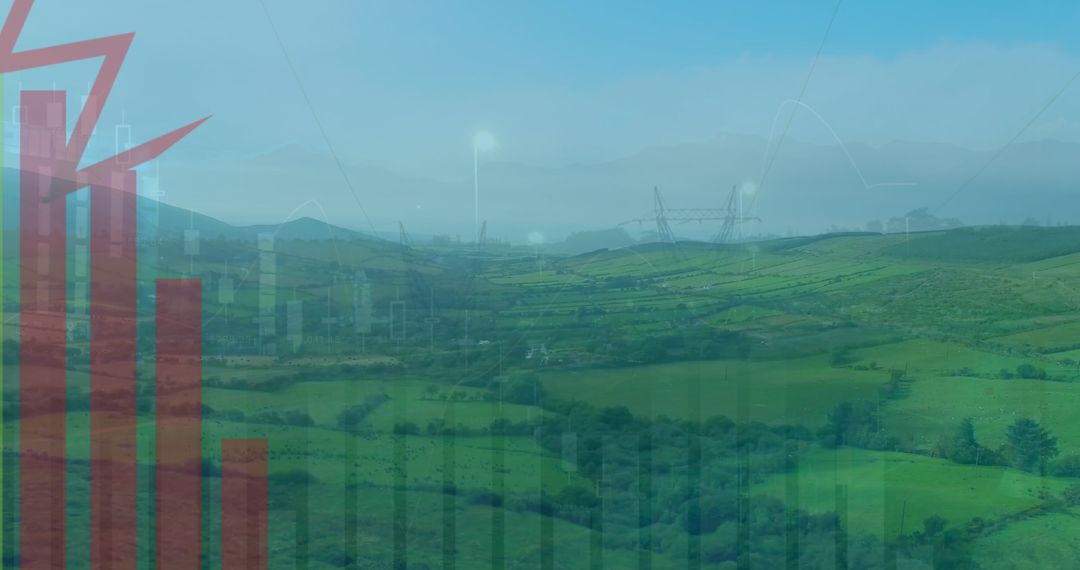
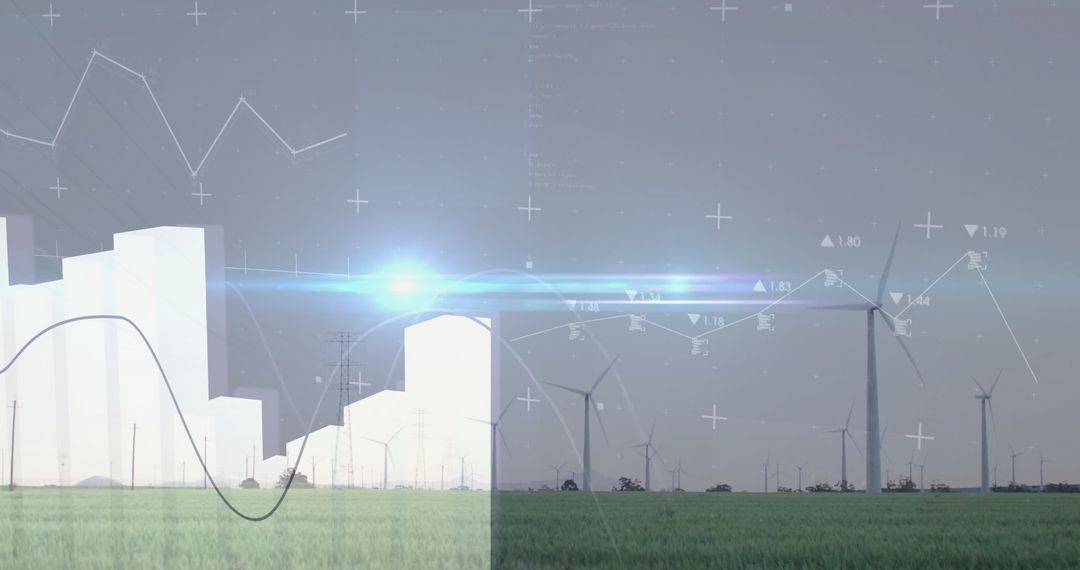
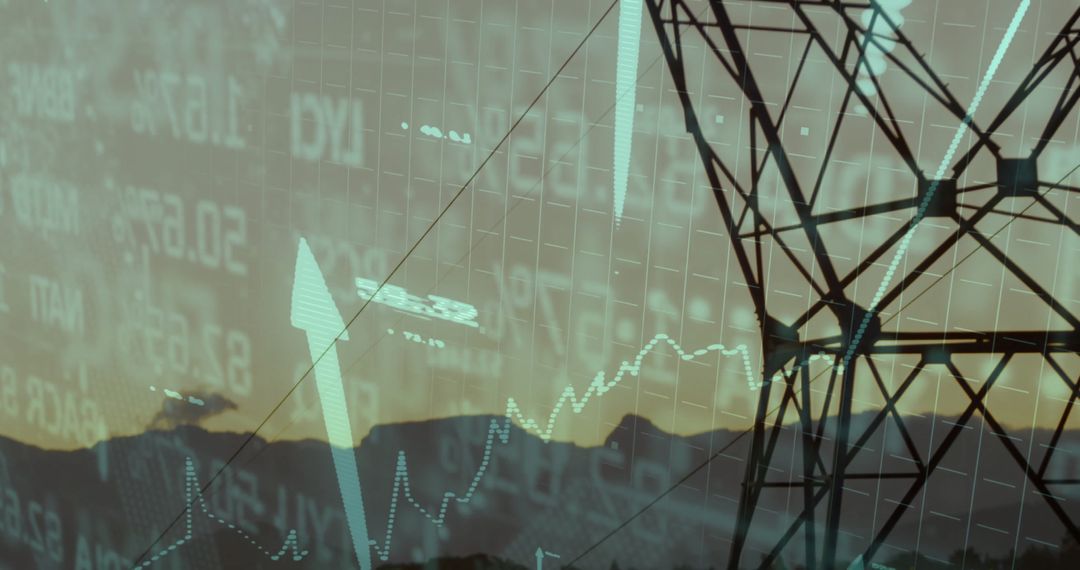
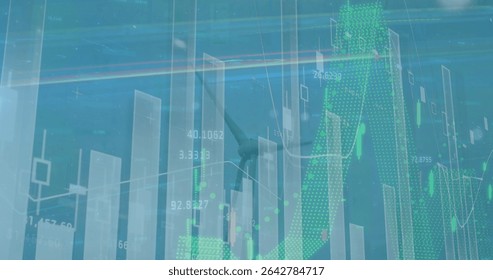
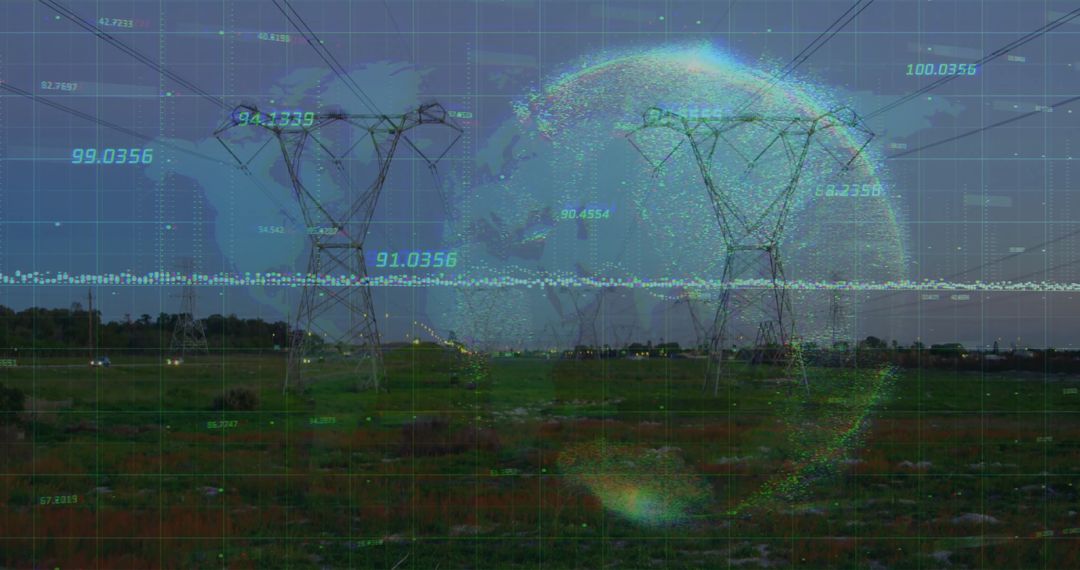
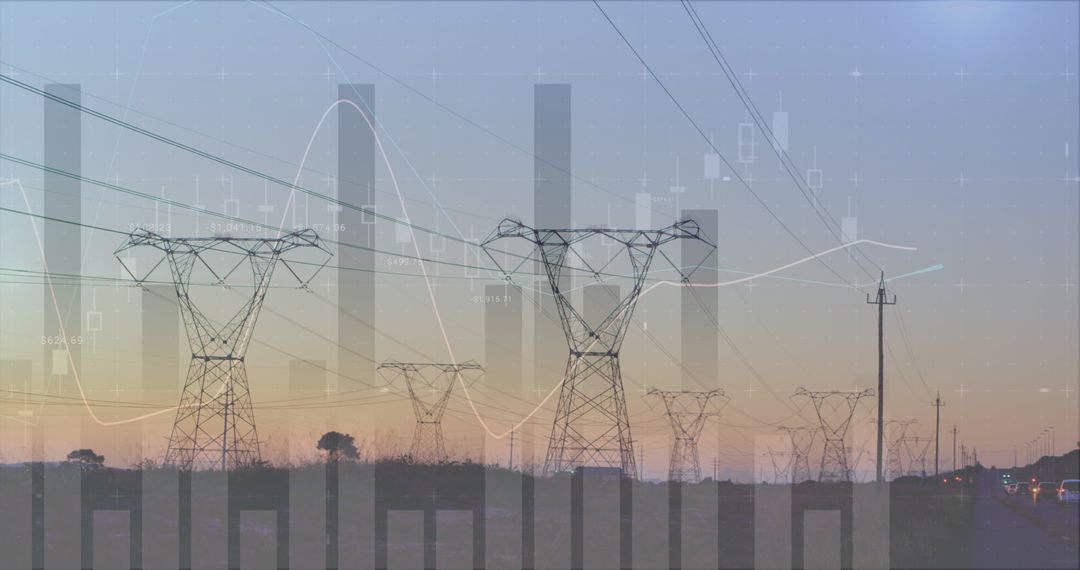
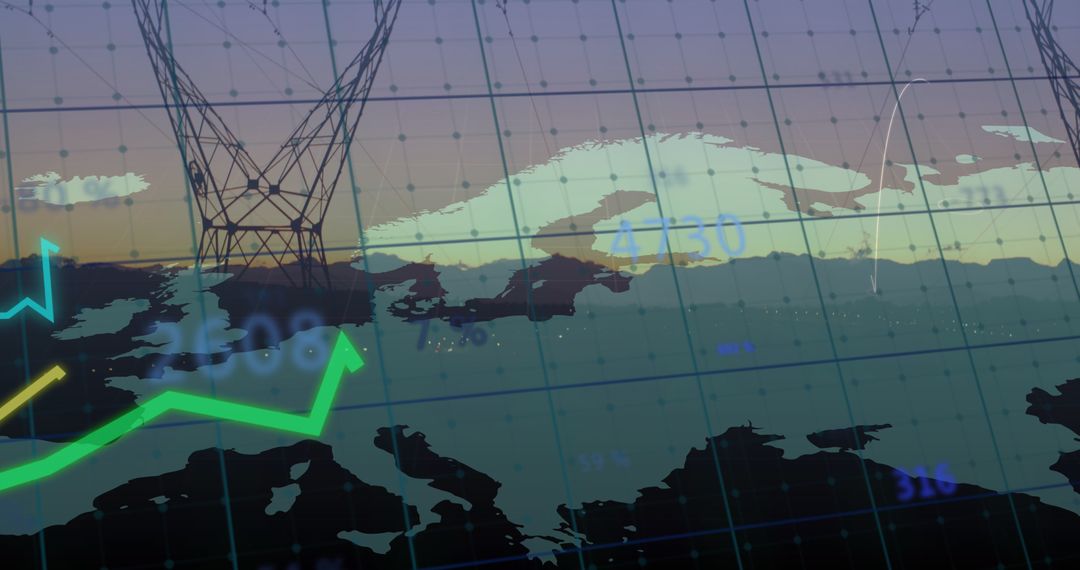
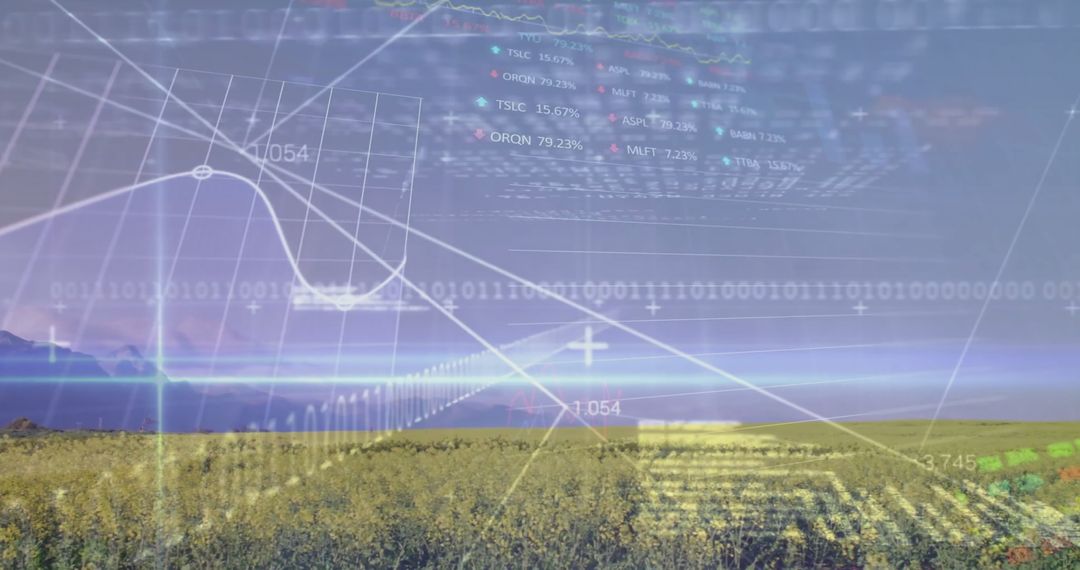
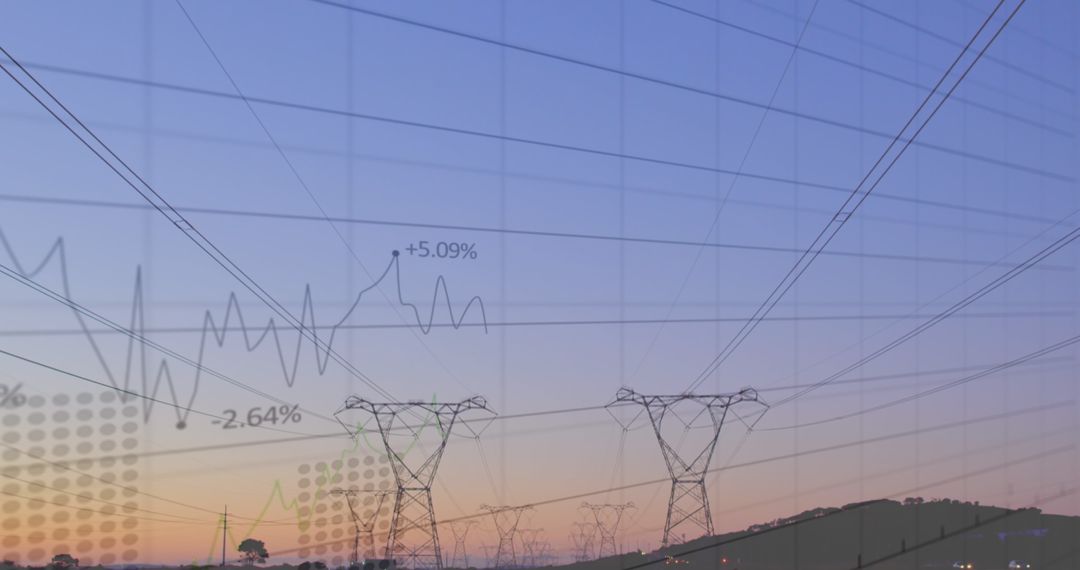
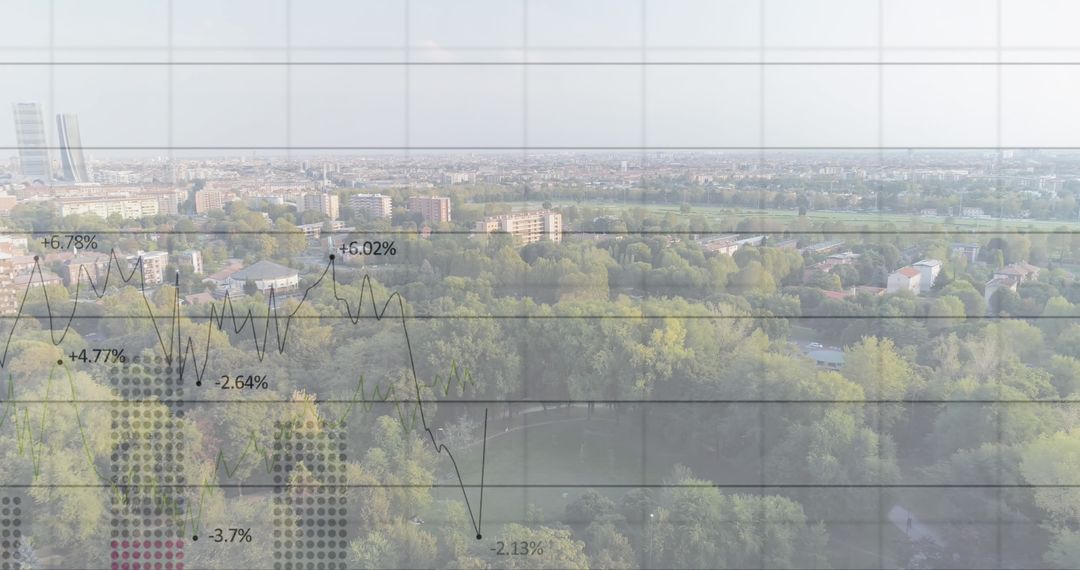
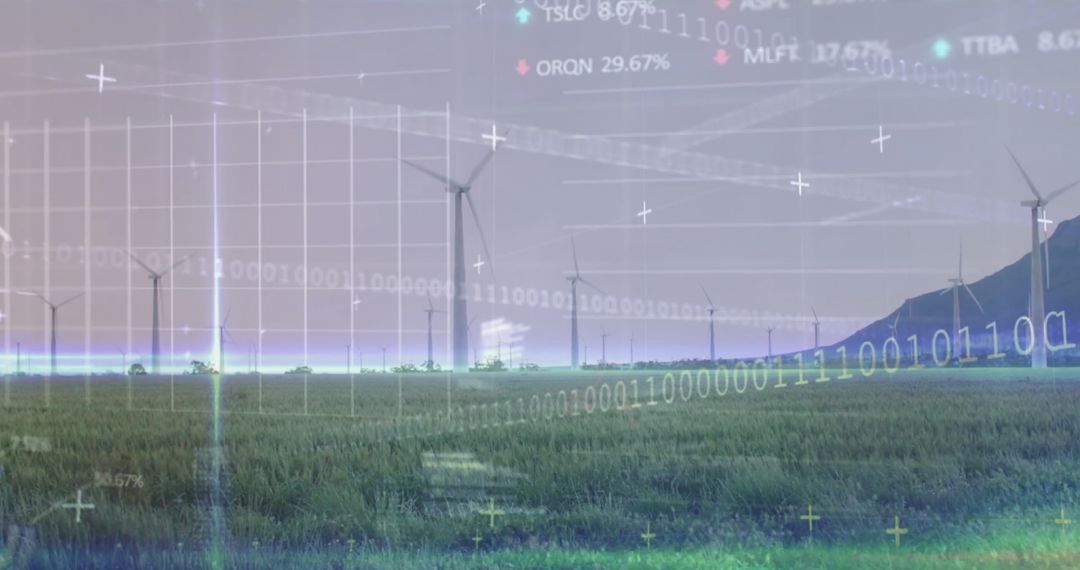
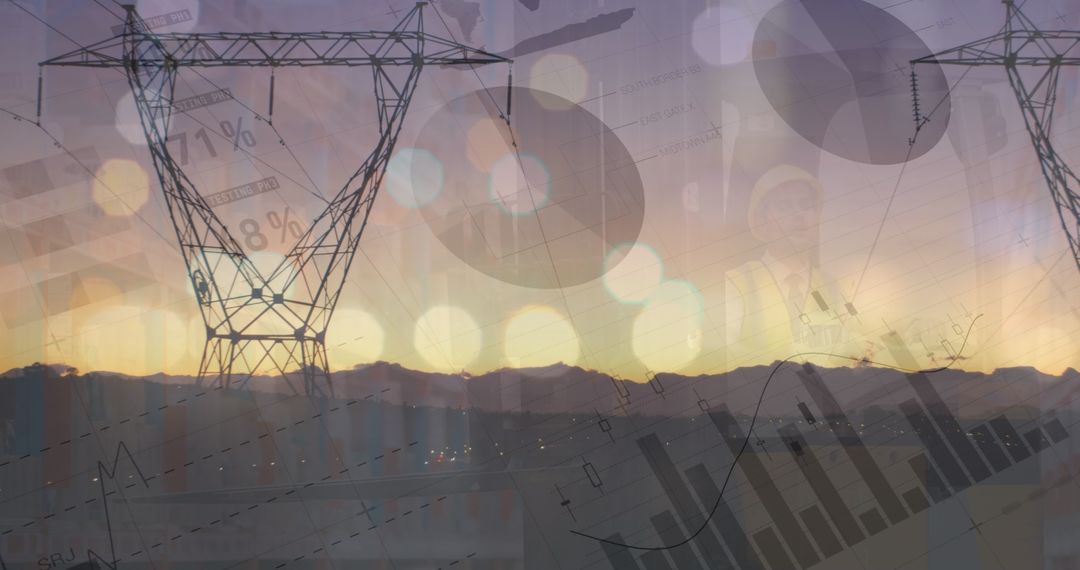
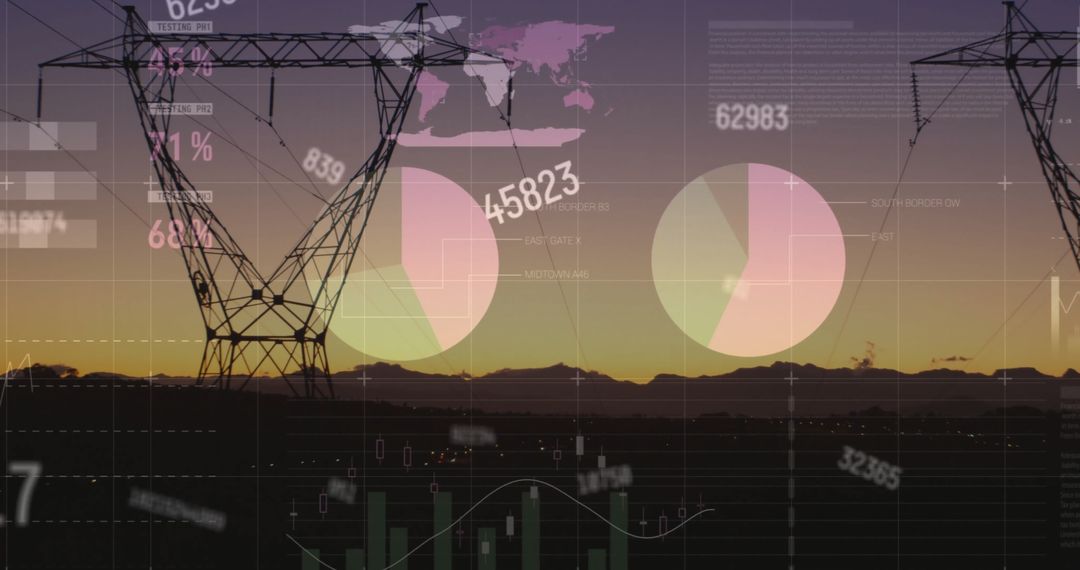
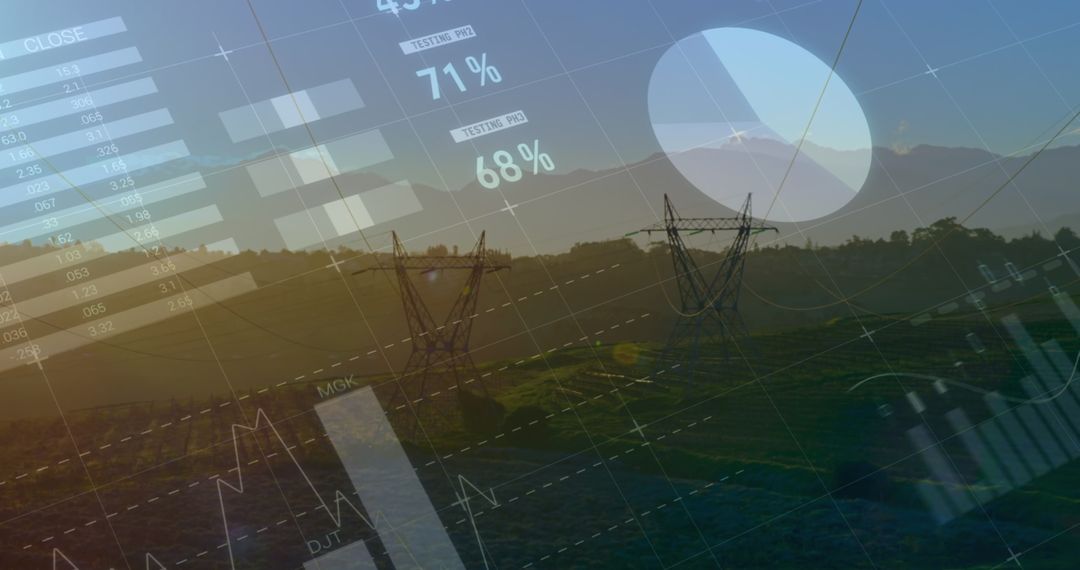
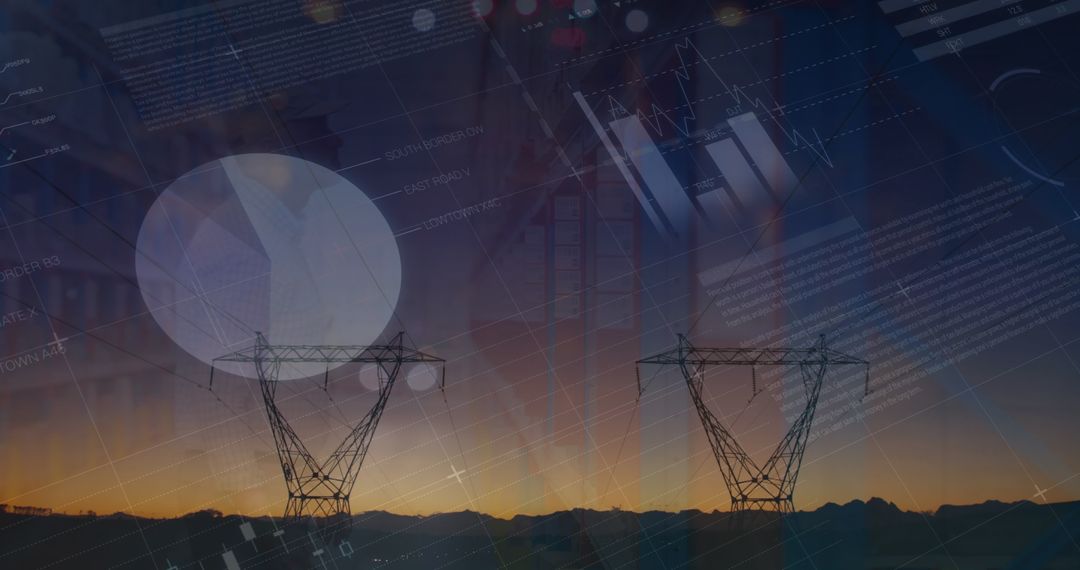
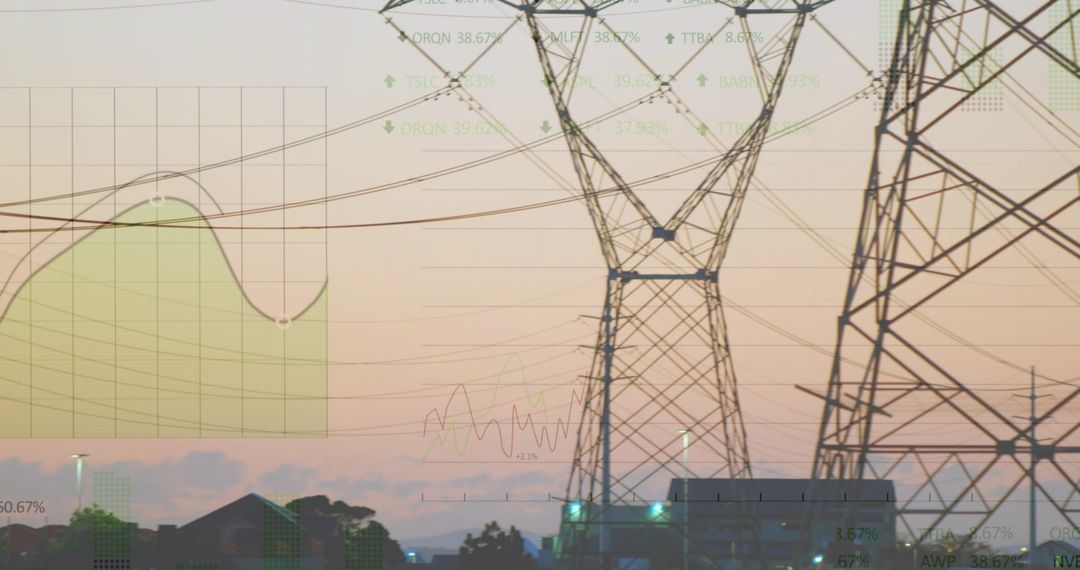
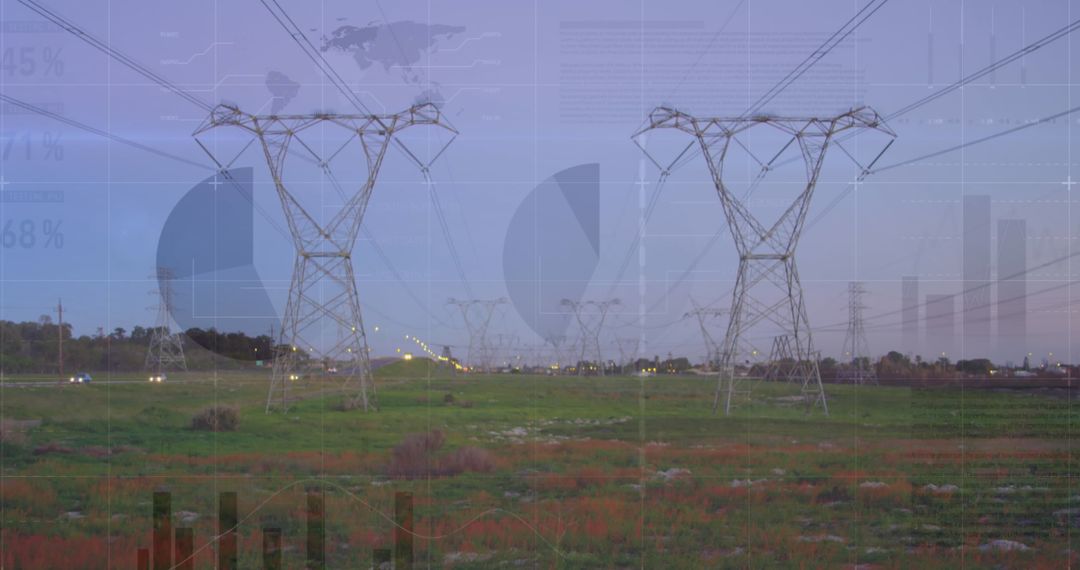
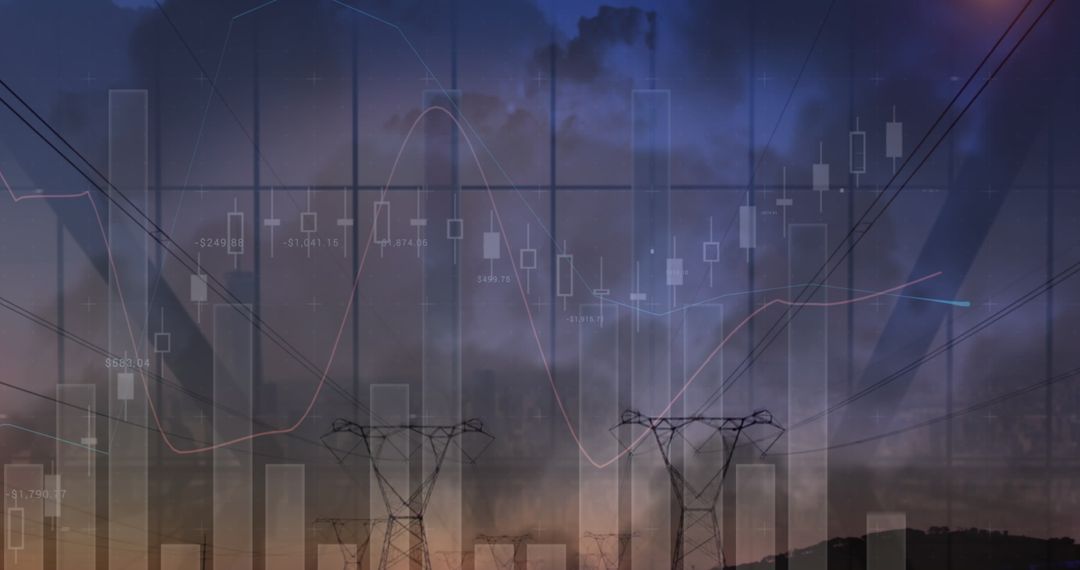
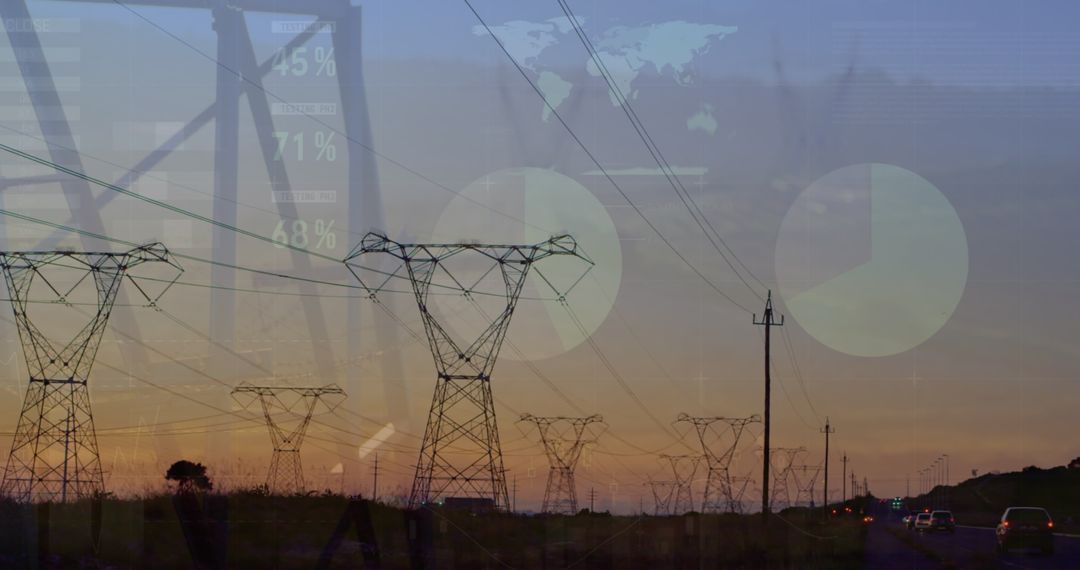
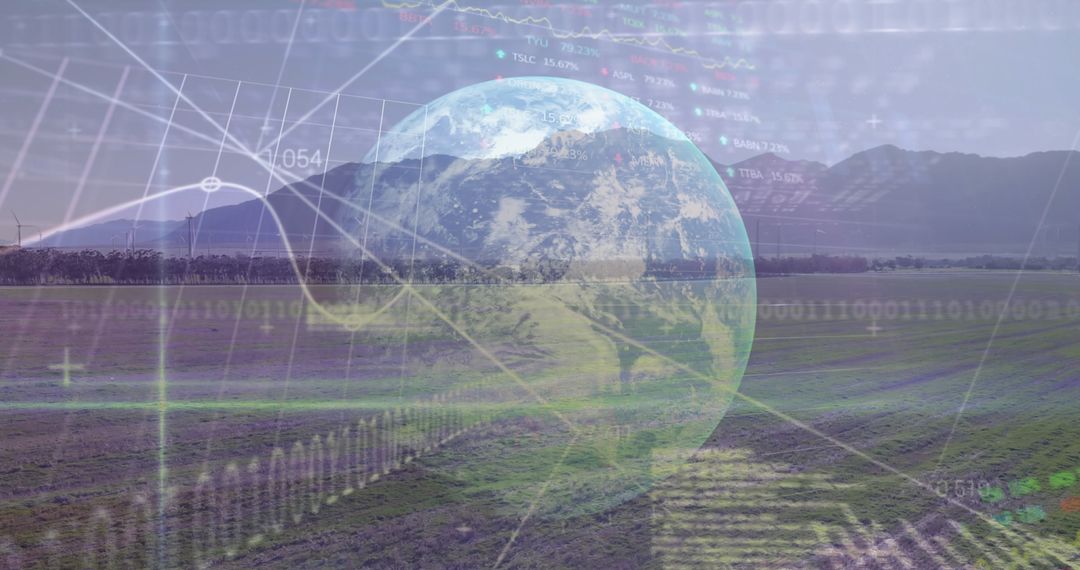
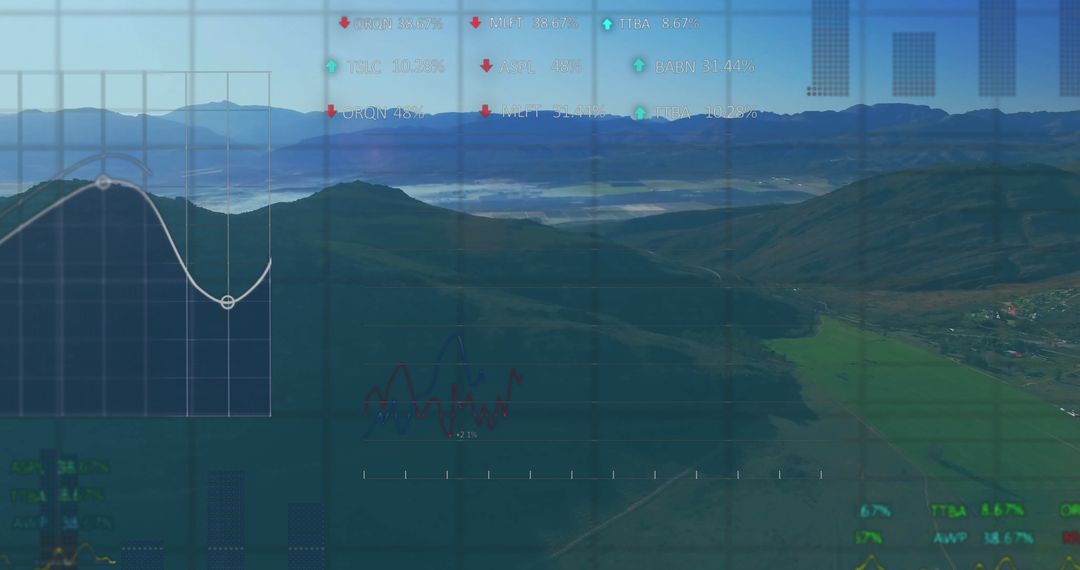
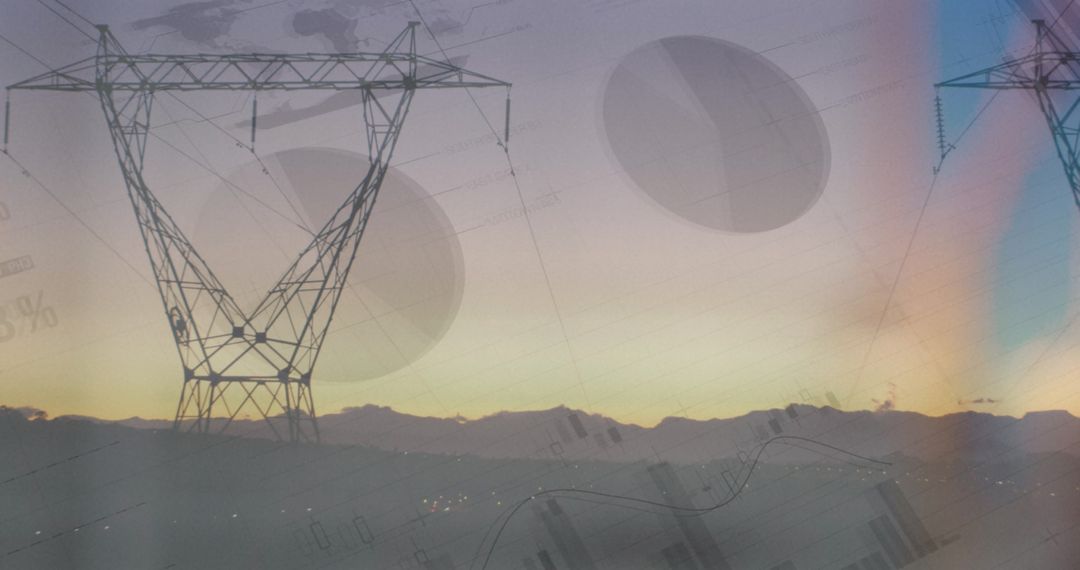
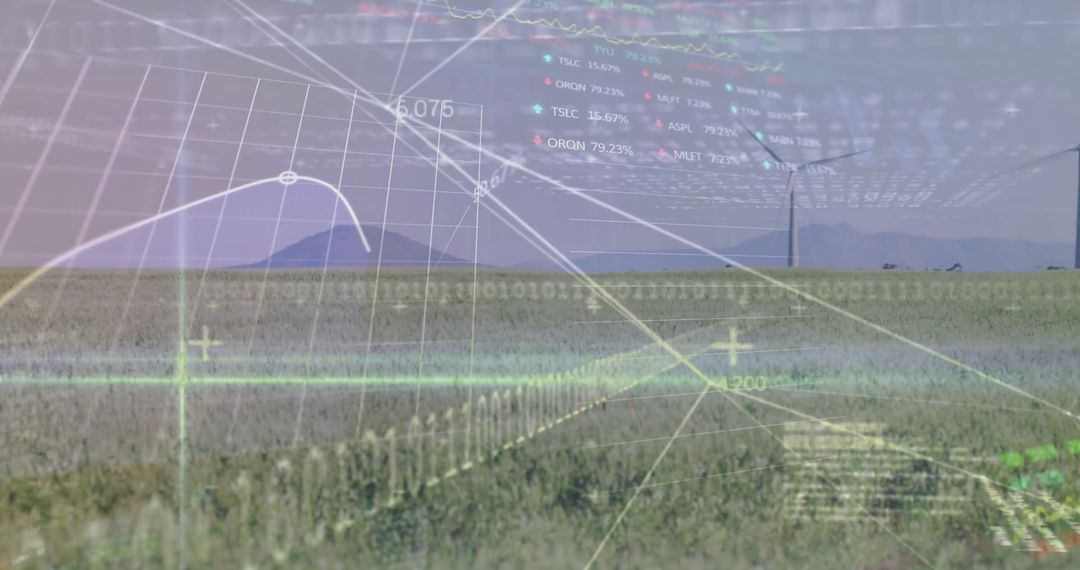
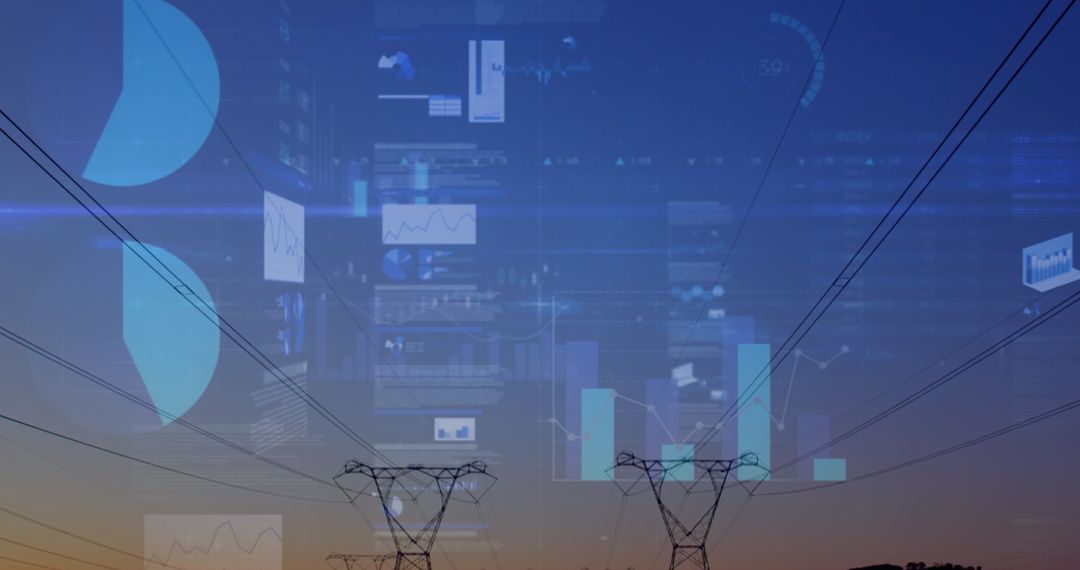
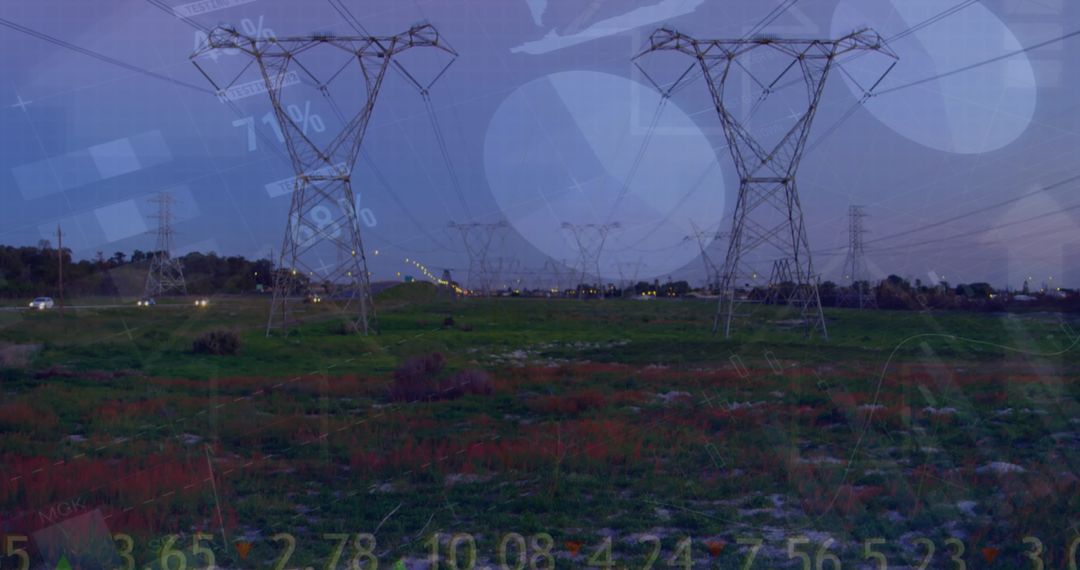
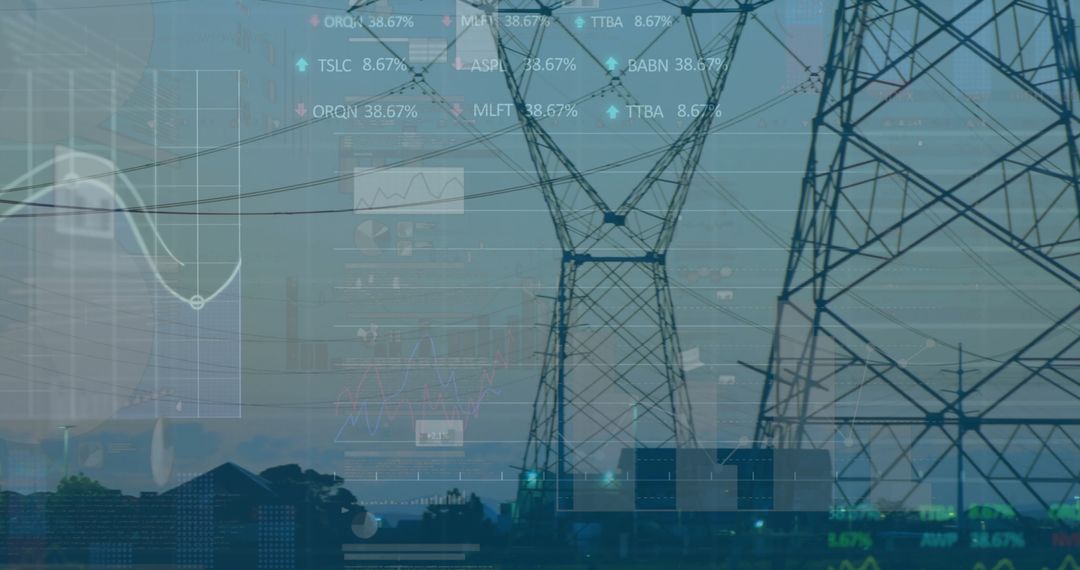
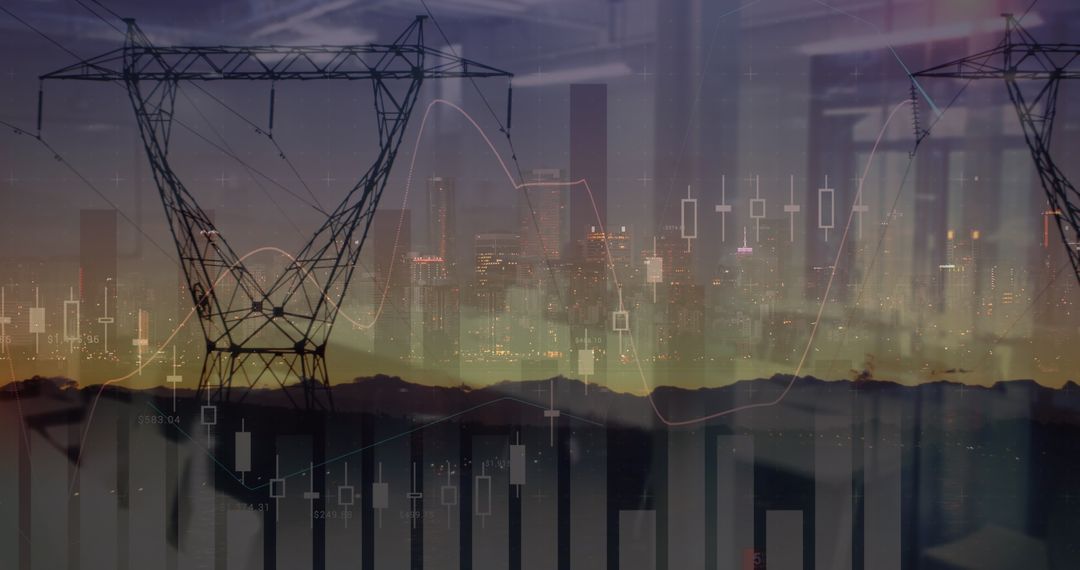
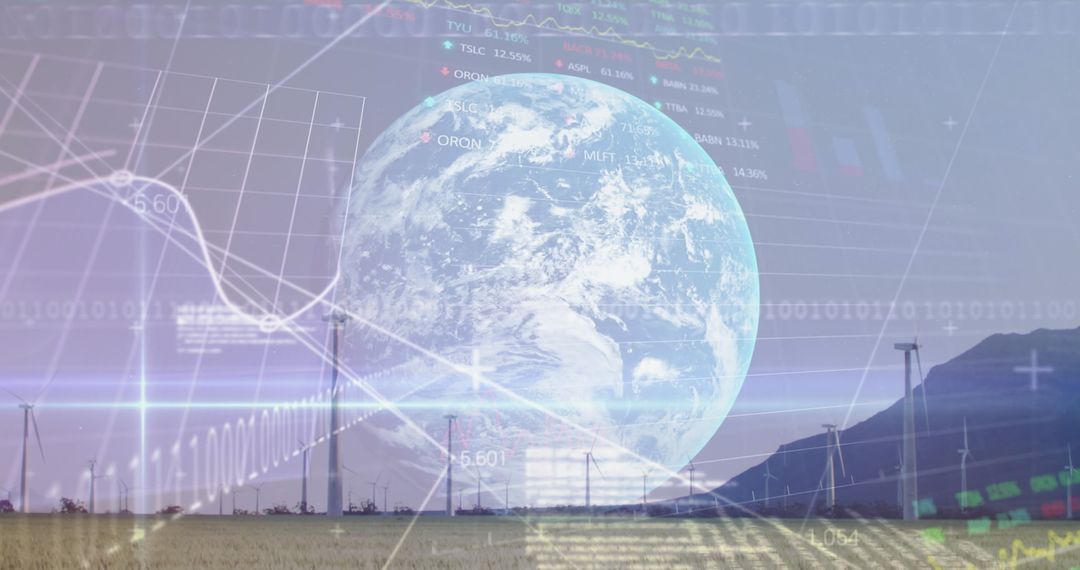
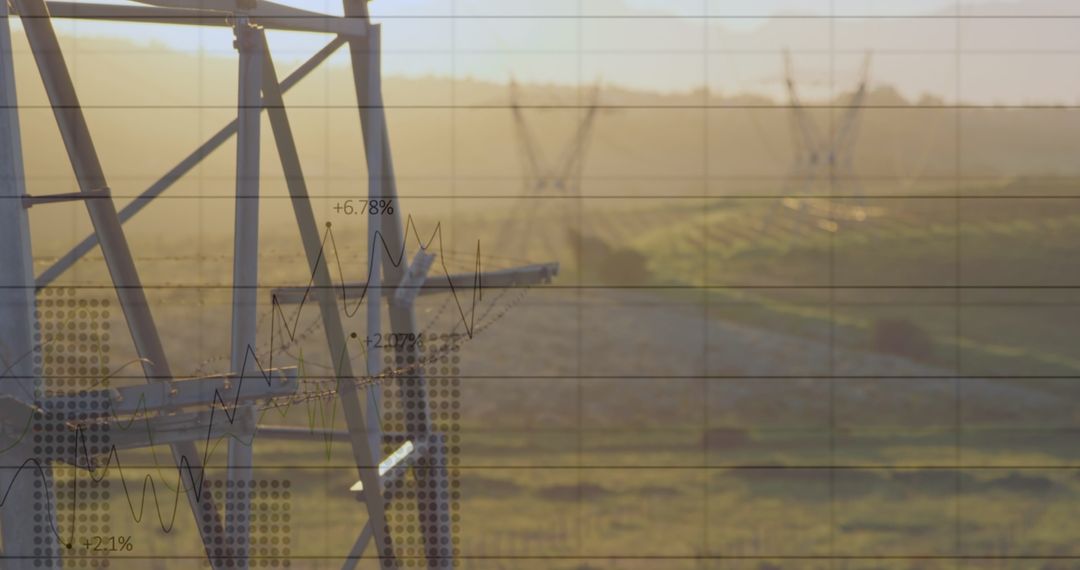
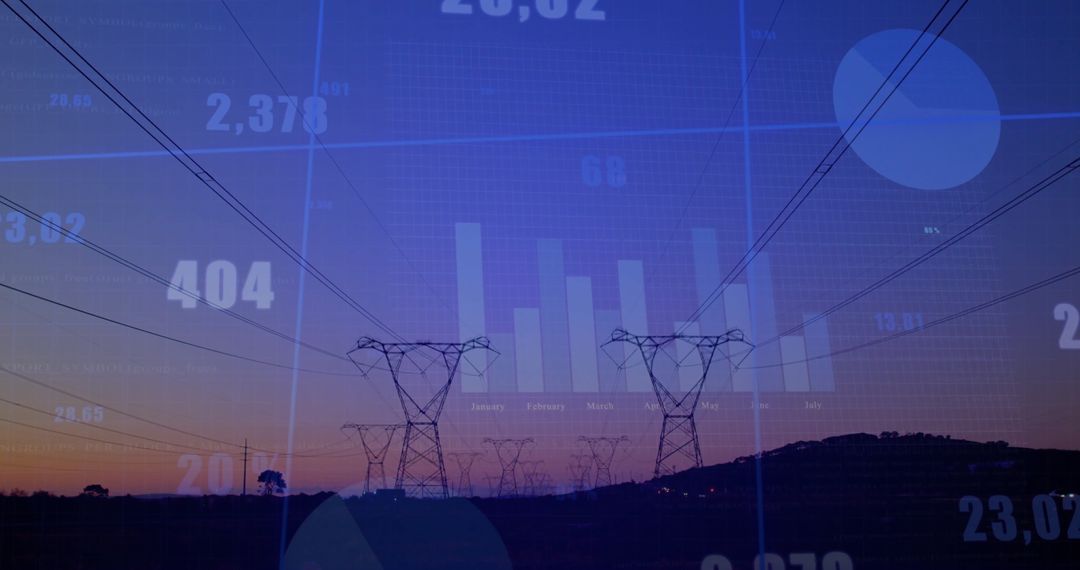
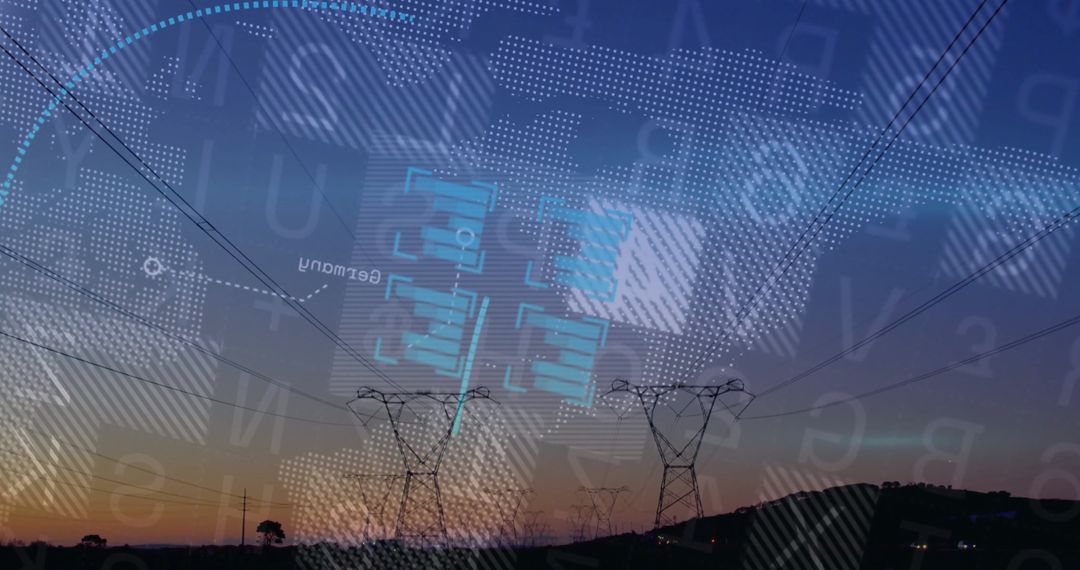
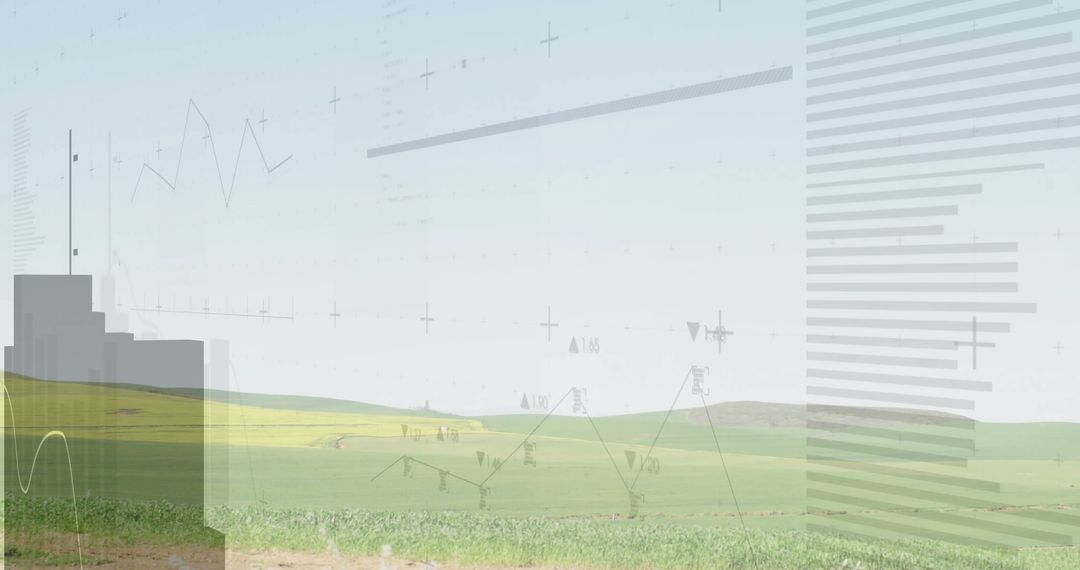
Conceptual visualization showing overlap of energy infrastructure and financial graphs, representing global trends in utilities and investments. Uses include business reports on energy sectors, presentations on financial growth linked to electricity demand, and educational material on merging energy decisions with financial modeling.
Powered by  - Get 15% off with code: PIKWIZARD15


2
downloads
downloads
Tags:
More
Credit Photo
If you would like to credit the Photo, here are some ways you can do so
Text Link
photo Link
<span class="text-link">
<span>
<a target="_blank" href=https://pikwizard.com/photo/energy-market-and-financial-data-integration-visualization/3d7e0392c0c417c84b24ad1d88b26f4e/>PikWizard</a>
</span>
</span>
<span class="image-link">
<span
style="margin: 0 0 20px 0; display: inline-block; vertical-align: middle; width: 100%;"
>
<a
target="_blank"
href="https://pikwizard.com/photo/energy-market-and-financial-data-integration-visualization/3d7e0392c0c417c84b24ad1d88b26f4e/"
style="text-decoration: none; font-size: 10px; margin: 0;"
>
<img src="https://pikwizard.com/pw/medium/3d7e0392c0c417c84b24ad1d88b26f4e.jpg" style="margin: 0; width: 100%;" alt="" />
<p style="font-size: 12px; margin: 0;">PikWizard</p>
</a>
</span>
</span>
Free (free of charge)
Free for personal and commercial use.
Author: Creative Art
Similar Free Stock Images

Premium


Premium


Premium


Premium


Premium


Premium


Premium


Premium


Premium


Premium


Premium


Premium


Premium


Premium


Premium


Premium


Premium


Premium


Premium


Premium


Premium


Premium

Premium


Premium