
- Home >
- Stock Photos >
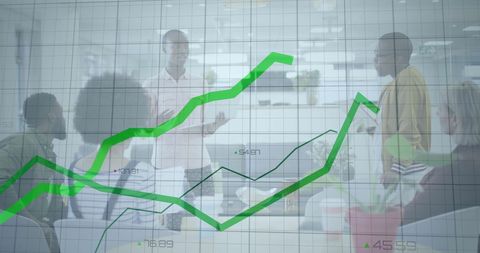
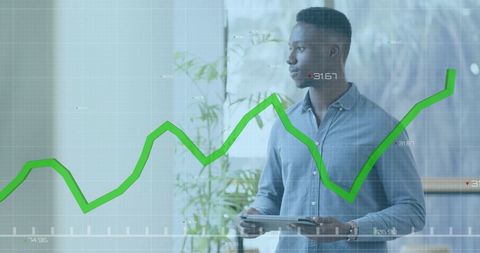
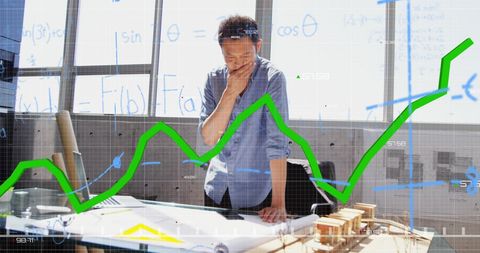
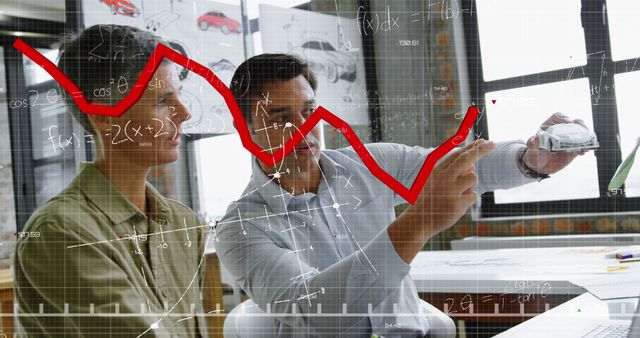
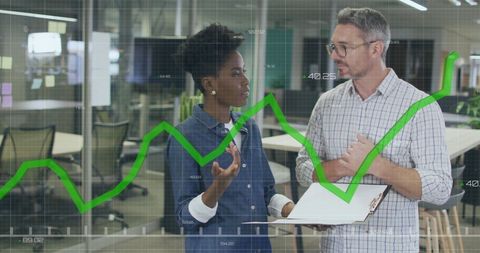
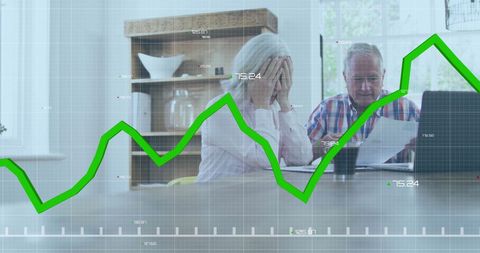
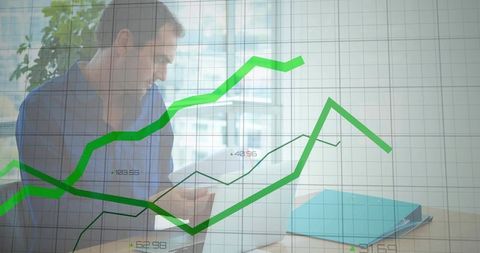
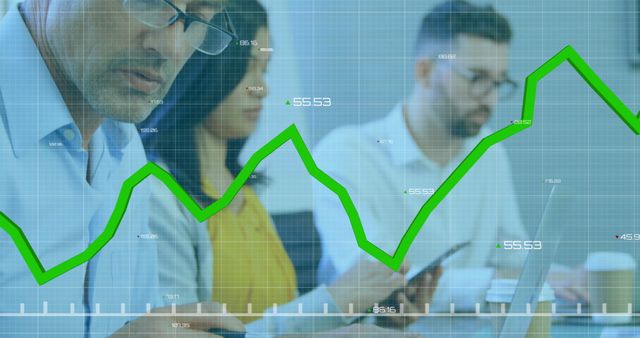
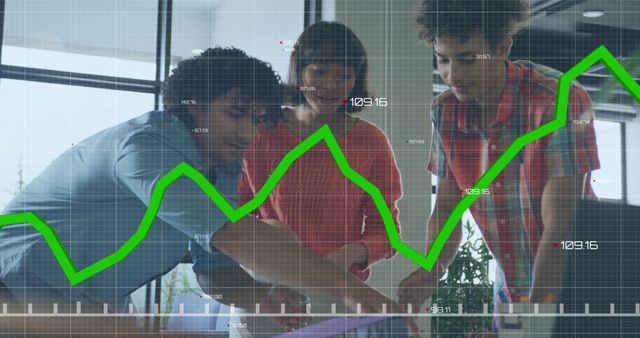
- Engineers Analyzing Data with Financial Graphs and Mathematics
Engineers Analyzing Data with Financial Graphs and Mathematics Image
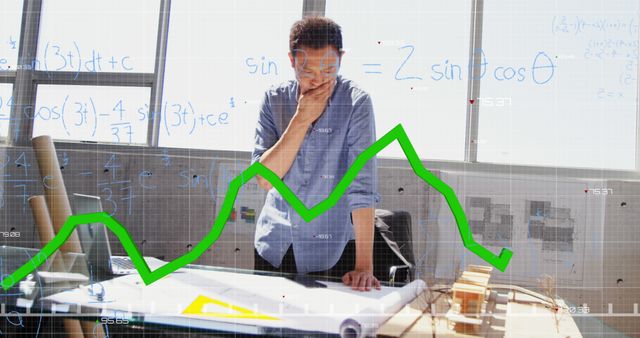
A Caucasian man examines papers at a table, with overlaid green graph and mathematical formulae symbolizing the convergence of finance, technology, and calculation. Ideal for depicting innovation in financial analysis, engineering processes, or data-driven decision-making.
Powered by 


downloads
Tags:
More
Credit Photo
If you would like to credit the Photo, here are some ways you can do so
Text Link
photo Link
<span class="text-link">
<span>
<a target="_blank" href=https://pikwizard.com/photo/engineers-analyzing-data-with-financial-graphs-and-mathematics/bd9d7ef773e77874140f59bf6e59b702/>PikWizard</a>
</span>
</span>
<span class="image-link">
<span
style="margin: 0 0 20px 0; display: inline-block; vertical-align: middle; width: 100%;"
>
<a
target="_blank"
href="https://pikwizard.com/photo/engineers-analyzing-data-with-financial-graphs-and-mathematics/bd9d7ef773e77874140f59bf6e59b702/"
style="text-decoration: none; font-size: 10px; margin: 0;"
>
<img src="https://pikwizard.com/pw/medium/bd9d7ef773e77874140f59bf6e59b702.jpg" style="margin: 0; width: 100%;" alt="" />
<p style="font-size: 12px; margin: 0;">PikWizard</p>
</a>
</span>
</span>
Free (free of charge)
Free for personal and commercial use.
Author: People Creations
Similar Free Stock Images
Premium


Premium


Premium


Premium


Premium


Premium


Premium


Premium

Premium

Premium


Premium


Premium

Premium


Premium


Premium


Premium

Premium


Premium


Premium


Premium


Premium


Premium


Premium


Premium


Premium


Explore More Free Stock Images