- Home >
- Stock Photos >
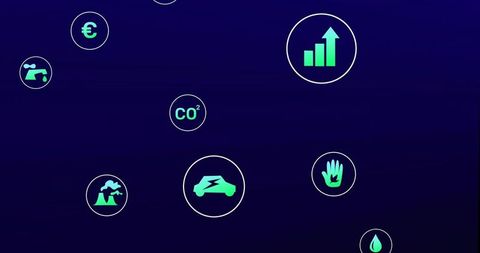
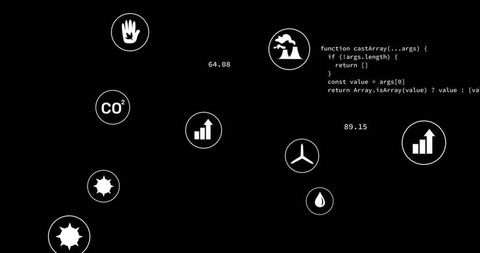
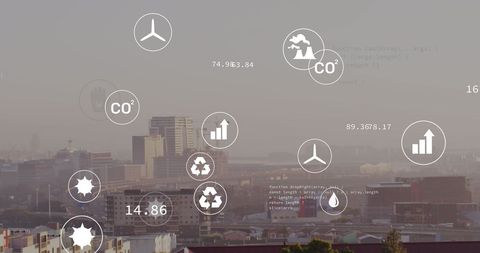
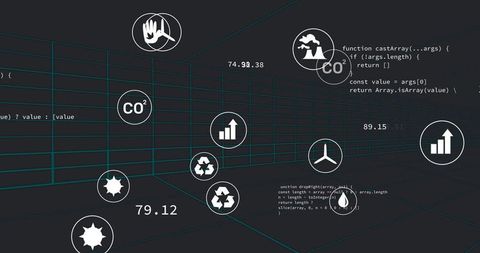
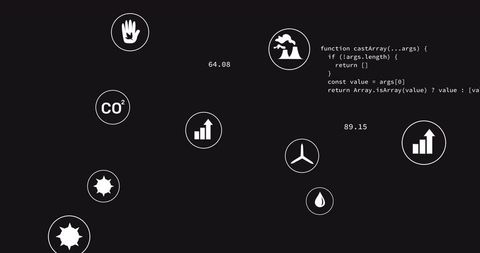
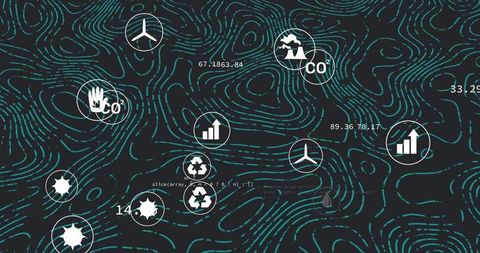
- Environmental Data Analytics Dashboard with Global Map and Icons
Environmental Data Analytics Dashboard with Global Map and Icons Image

This graphic displays a modern digital analytics dashboard, showcasing a blend of world maps and environmental data points against a dark grid background. Highlighting multiple icons such as wind turbines, CO2 levels, recycling symbols and bar graphs, this setup is useful for visualizing data in environmental sciences, sustainability projects, technology development or energy management reports. It is ideal for presentations, analytical reports or media depicting ecological footprints and global sustainability efforts.

downloads
Tags:
More
Credit Photo
If you would like to credit the Photo, here are some ways you can do so
Text Link
photo Link
<span class="text-link">
<span>
<a target="_blank" href=https://pikwizard.com/photo/environmental-data-analytics-dashboard-with-global-map-and-icons/f36408f4c67c75b5d61caa0d7d0de7a1/>PikWizard</a>
</span>
</span>
<span class="image-link">
<span
style="margin: 0 0 20px 0; display: inline-block; vertical-align: middle; width: 100%;"
>
<a
target="_blank"
href="https://pikwizard.com/photo/environmental-data-analytics-dashboard-with-global-map-and-icons/f36408f4c67c75b5d61caa0d7d0de7a1/"
style="text-decoration: none; font-size: 10px; margin: 0;"
>
<img src="https://pikwizard.com/pw/medium/f36408f4c67c75b5d61caa0d7d0de7a1.jpg" style="margin: 0; width: 100%;" alt="" />
<p style="font-size: 12px; margin: 0;">PikWizard</p>
</a>
</span>
</span>
Free (free of charge)
Free for personal and commercial use.
Author: Awesome Content