1. Home > 
  2. Stock Photos > 
  3. Environmental Data Analytics Merging Tech and Sustainability

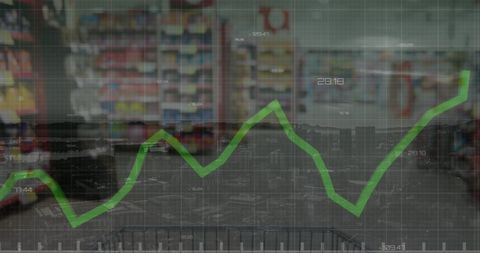
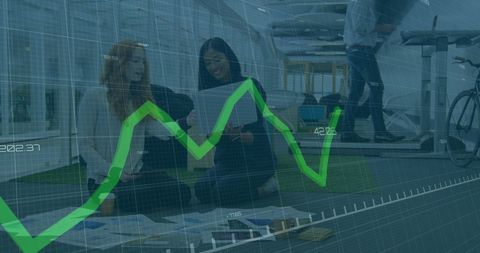
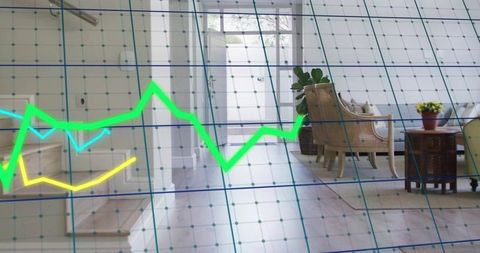
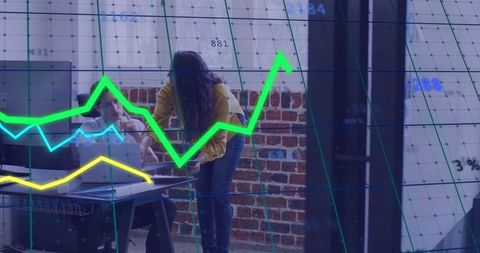
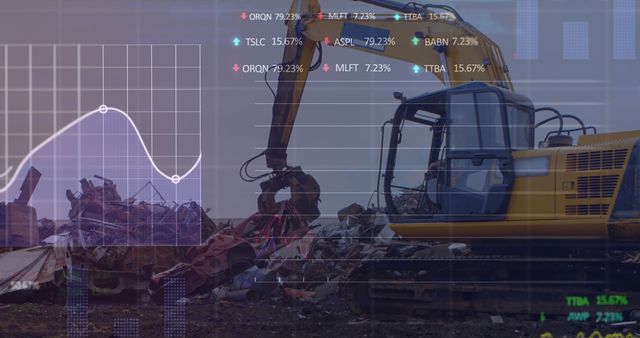
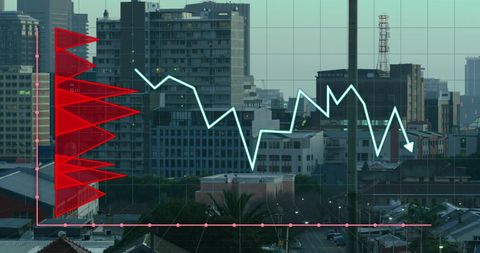
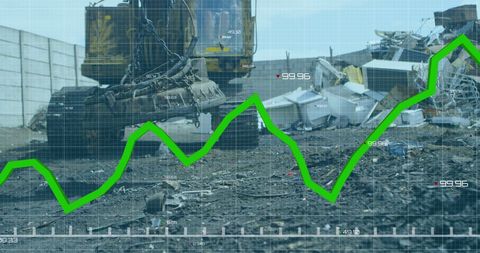
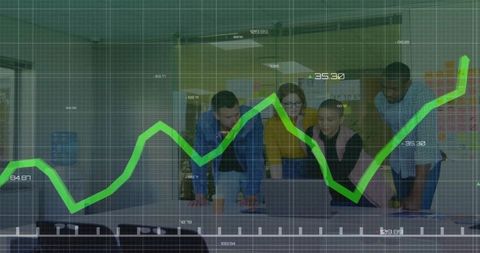
Environmental Data Analytics Merging Tech and Sustainability Image

Environmental Data Analytics Merging Tech and Sustainability

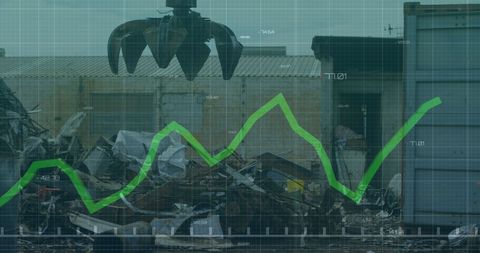
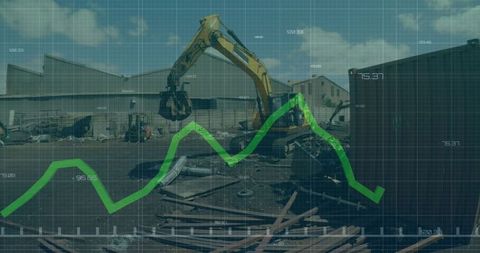
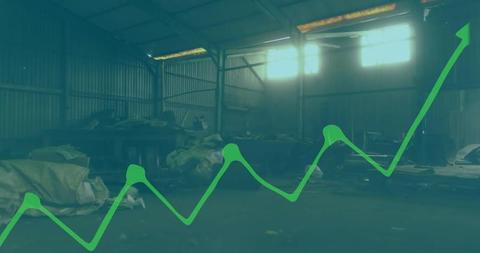
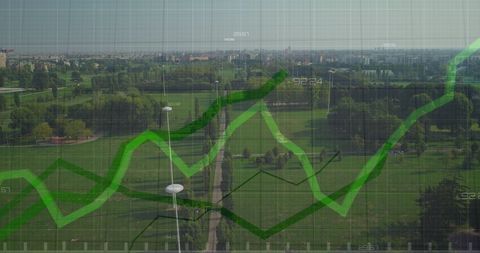
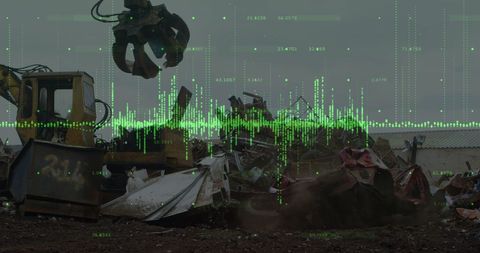
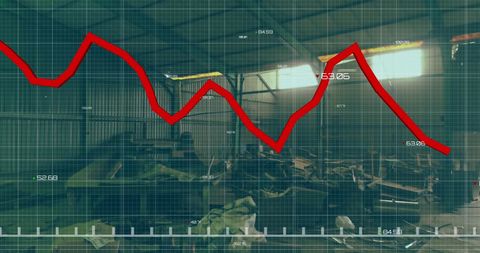
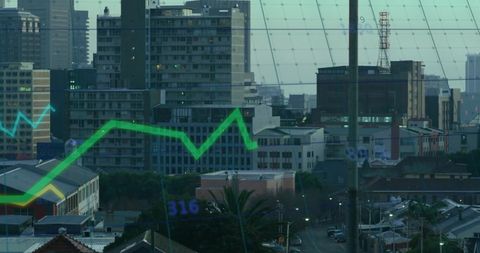
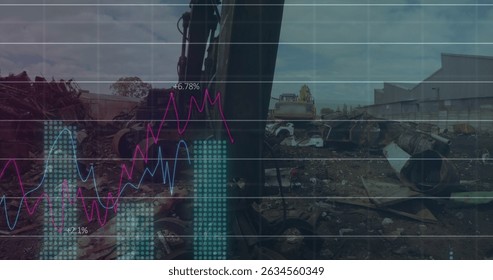
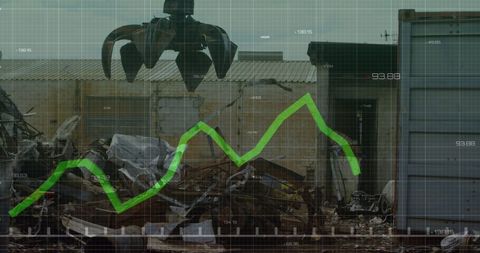
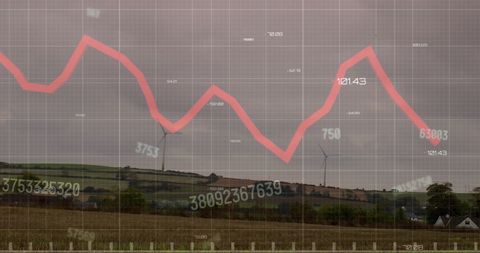
This visual represents the intersection of technology and environmental data, highlighting sustainability efforts. The prominent green graph overlay suggests analysis in recycling and waste management. Ideal for illustrating concepts related to environmental sustainability, digital transformation, and global economic trends in relation to ecological impacts.

Powered by Adobe logo
Highlighted data analyst job opening in newspaper classifieds section - Powered by AdobeBiotech research tools including microplates and pipette tips, isolated on white background - Powered by Adobedigital Iceberg with ideas above water and data below, symbolizing hidden analysis - Powered by AdobeA close-up, macro shot of a black pen tip touching a red line on a digital screen displaying stock market data with green and orange glowing elements and bokeh - Powered by AdobeSearch engine optimization tips for online marketing strategies and digital content creation success today - Powered by Adobe

Credit Photo

If you would like to credit the Photo, here are some ways you can do so

Free (free of charge)

Free for personal and commercial use.

Author: Creative Art

Similar Free Stock Images

Digital Financial Graph Overlapping Modern Cityscape
Premium
Email marketing strategy tips for business growth and communication new message notification inbox concept
Data Analysis and Graph Display in Modern Server Room
Growing Financial Trends on Urban Skyline Background
Diverse Team Analyzing Financial Growth Chart in Conference
Financial Data Overlay on Business Meeting Collaborative Strategy
Premium
Displaying data chart on monitor, with blue peaks, yellow line, cyan curve, white arrow glowing red
Digital Financial Analytics Over Construction Backdrop
Digital Technology Integration in Modern Construction Industry
Data Analysis Overlay on Junkyard Recycling Scene
Financial Data Analysis with Cityscape Background
Premium
robotic AI driven landfill site with holographic analysis displays data visualizations and machinery in background, showcasing advanced technology in waste management
Economic Growth Chart Over Urban Cityscape with Digital Interface
Rising Data Trends Overlaying Industrial Waste Scene
Financial Graphs Merging with Industrial Machinery
Financial Graph Overlaid on Automated Recycling Junkyard Scene
Premium
Data analysis shows waste management trends, recycling impact with bar charts, pie charts, line graphs. Visualization of environmental statistics tracks disposal practices, reduction, sustainability
Industrial Machinery and Financial Growth Chart
Fluctuating Line Graph Over Abandoned Factory Scene
Industrial Scrap Yard with Digital Financial Graphs
Innovation in Green Technology Amidst Urban Expansion
Premium
Seo optimization tips and strategies for search engine ranking on google and bing website marketing 100
Dynamic Growth Graph Over Night City Traffic Scene
Business Presentation with Trend Analysis Overlay
Dynamics of Financial Growth in Modern Business Setting
Diverse Business Team Analyzing Financial Data Illustration
Premium
Email marketing strategy new message notification inbox management digital communication tips
Two Businesswomen Analyzing Growing Financial Trends in Office
Business Performance Analysis in Industrial Warehouse
Digital Data Analytics Overlay on Urban Skyline
Digital Data Analytics Overlay in Modern Office Environment
Algeria Financial Growth in Oil Industry with Data Overlay
Digital Data Overlay on Industrial Crane at Junkyard
Premium
Modern skyscraper with illuminated tip against dark sky, representing finance and technological advancement with data visualization effects
Green Financial Data Line Graph Over Cityscape Background
Businesswomen Analyzing Data on Laptop With Digital Graph Overlay
Stock Market Data Overlay on Excavator in Junkyard Render
Business Growth Concept with Graph Overlay
Premium
Seo concept with wooden blocks and magnifying glass on a dark background for search engine optimization
Financial Data Growth Over Urban Cityscape with Graph Overlay
Data Analysis Overlay on Crane Operation at Junkyard
Dynamic Business Analytics and Data Processing Visualization
Financial Data Overlays on Cityscape Visualizing Economic Trends
Premium
Boost your social media engagement with these simple tips and tricks for success, achieving viral growth and increased brand awareness.
Business Team Analyzing Financial Growth Analytics
Graph Line Chart Over Industrial Scrap Yard Concept
Financial Data Overlaid on Recycling Junkyard Scene
Diverse Businesswomen Analyzing Financial Growth Chart in Office
Premium
Seo optimization strategy tips and tricks for better search engine ranking and digital marketing success
Woman Using Smartphone with Data Visualization Overlay
Financial Growth Chart Superimposed on Industrial Junkyard
Financial Data Graph Overlay on Modern Office Background
Thailand Flag and Data Visually Merging with Waste Management Concept
Premium
digital Iceberg with ideas above water and data below, symbolizing hidden analysis
Dynamic Financial Statistics with Cityscape Overlay
Financial Chart Overlay on Modern Office Background
Colleagues Discussing Financial Data with Graph Overlay in Modern Office
Rising Data Graph Over Digital Servers in Futuristic Environment
Premium
Social media marketing campaign strategy online promotion and digital advertising tips
Abstract Financial Graph Displayed on Office Monitor
Green Line Graph Overlaid on Empty Office with Data Overlay
Construction Site with Overlaid Financial Graph
Algeria Financial Data with Oil Industry Background
Financial Data Overlay on Urban Cityscape Modern Business
Rising Green Market Graph Overlay in Dimly Lit Cityscape
Premium
Artificial intelligence helps achieve zero waste goals by optimizing recycling processes. AI technology analyzes data to create sustainable solutions, promoting a zero waste future. Entice
Diverse Businesswomen Analyzing Growth Graphs in High-Tech Office
Diverse Colleagues Analyzing Business Growth with Overlaid Graph
Financial Graphs Overlay on Urban Skyline Depicting Market Trends
Digital Financial Data Over Construction Site Skyline
Premium
Productivity management tips and strategies for maximum efficiency and time management success now
Financial Market Growth Over City Skyline
Financial Data over Wind Turbine Landscape Suggests Economic Trends
Financial Data with Graph Overlay on Urban Skyline
Financial Growth Data Over Office Team Meeting
Premium
Social media marketing strategy digital content creation engagement rate optimization tips for growth online 100
Financial Growth Graphs Over Junkyard Machines
Innovative Business Data Analytics Overlaying Urban Architecture
Diverse Team Celebrating Business Growth in Office Environment
Excavator on Construction Site with Digital Data and Analytics Overlay
Premium
Manager supervising work of stockbroker in office using AI LLM chatbot for instant market analysis and trading tips. Team leader overseeing worker integrating AI analytics to monitor stock market
Growth Statistics Overlay on Industrial Machinery
Business Growth Graph Overlay on Modern Urban Scene
Green Graph with Countryside Backdrop Indicates Market Trends
Digital Data Analysis over Cityscape Stock Market Concept
Premium
Digital Marketing Hands Typing on Laptop, Social Media Promotion
Colleagues Analyzing Stock Market Trends in Boardroom
Financial Team Analyzing Data with Innovative Digital Interface
Digital Data Processing Analysis Over Computer Servers
Businesswomen Analyzing Growth Trends in Modern Office Environment
Premium
Artificial intelligence helps achieve zero waste goals by optimizing recycling processes. AI technology analyzes data to create sustainable solutions, promoting a zero waste future. Entice
Heavy Machinery Amidst Landfill and Environmental Data Analysis
Data Analysis in Industrial Waste Environment
Innovative Data Processing at Junkyard Industrial Site
Financial Data Overlapping Modern Cityscape
Diverse Business Team Discussing Financial Analysis over Data Graph
Digital Finance Graph Over Urban Skyline
Premium
Payroll management software for small business online automated payroll system solutions guide tips
Diverse Female Colleagues Analyzing Market Trends on Laptop
Financial Data Graph Over Urban Cityscape
Financial Data Visualization Over Construction Site
Construction Site Merging with Financial Data Stream
Premium
Pen is sitting on a piece of paper with a graph on it. The pen is black and has a gold tip. The graph on the paper shows a downward trend
Business Presentation with Growth Analytics Graphic Overlay
Rising Graph Over Digital Urban Skyline Displaying Growth
Growth Data Visuals Overlaying Urban Supermarket Aisle
Rising Green Line Over City Symbolizes Business Growth
Premium
AI text and Question mark symbol on the wooden cubes, confusion about AI, how to use, and ask, questions about AI technology
Cryptocurrency Market Fluctuations Concept with Digital Interface
Industrial Machinery Handling Scrap Metal with Digital Data Visualization
Digital Financial Analysis in Junkyard Background
Decreasing Trend Graph Over Urban Cityscape at Dusk
Premium
Understanding tax concepts and digital tools for efficient tax management in a modern workspace
Diverse Team Analyzing Data with Graph Overlay in Office
Economic Decline Graph Overlay on Cityscape Depicting Uncertainty
Statistical Analysis Merging with Junkyard Operations: Interface Technology Visualized
Data Center with Rising Trends on Digital Graph
Premium
Increase your social media engagement with these simple tips and tricks for boosting likes, comments, and shares on your posts and stories.
Global Business Innovation Team Collaborating over Digital Data Visualization
Financial Data Analysis in Professional Business Meeting
Financial Technology Team Analyzing Data in Modern Office
Financial Growth with Diverse Professionals Analyzing Chart Data
Premium
entrepreneurship tips startup scalability resilience A business professional displaying a digital growth chart on a tablet device.
Team Analyzing Data with Line Graph Overlay in Modern Office