- Home >
- Stock Photos >
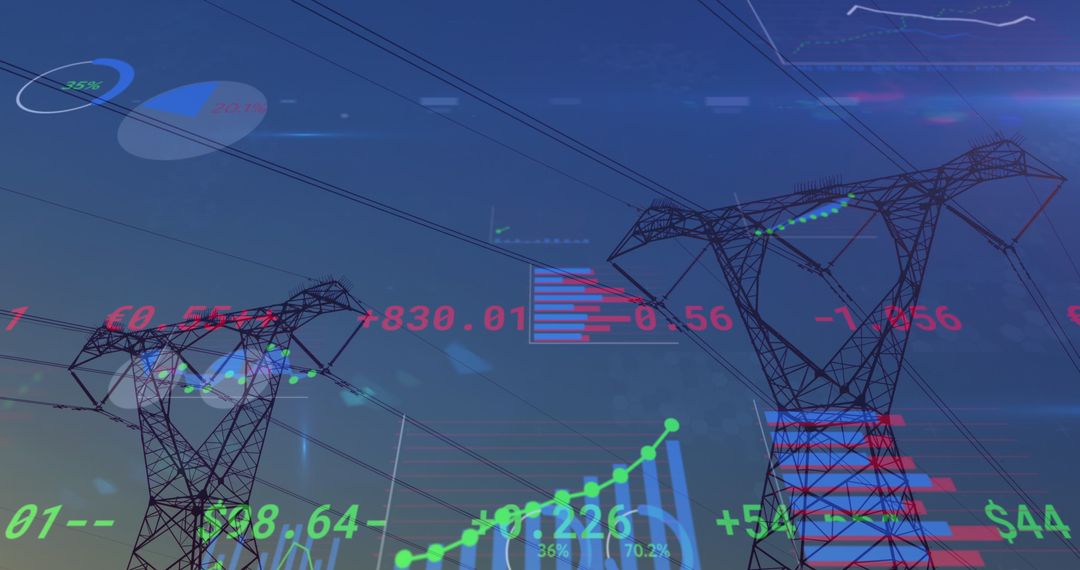
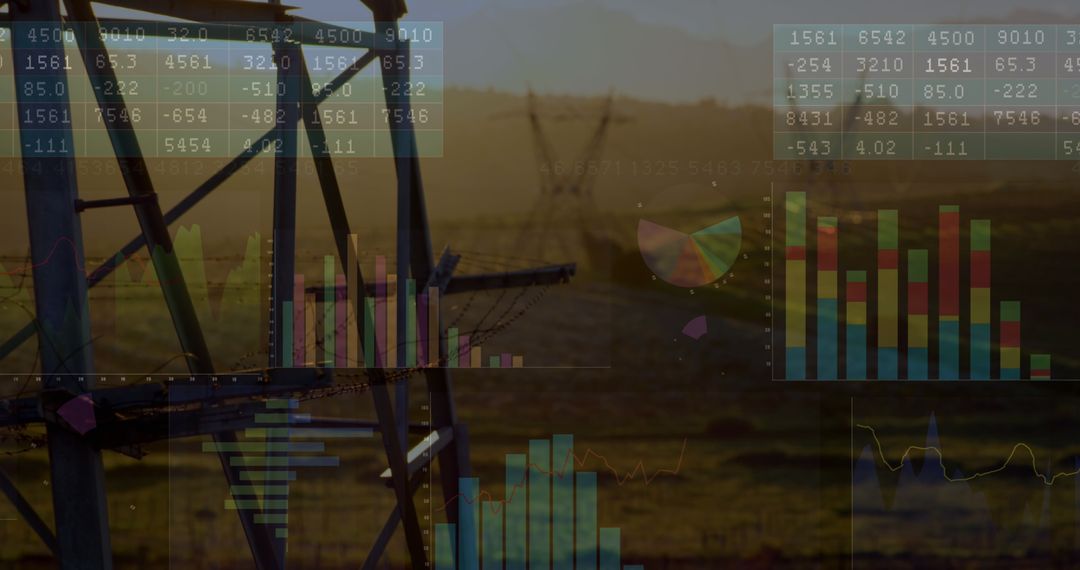
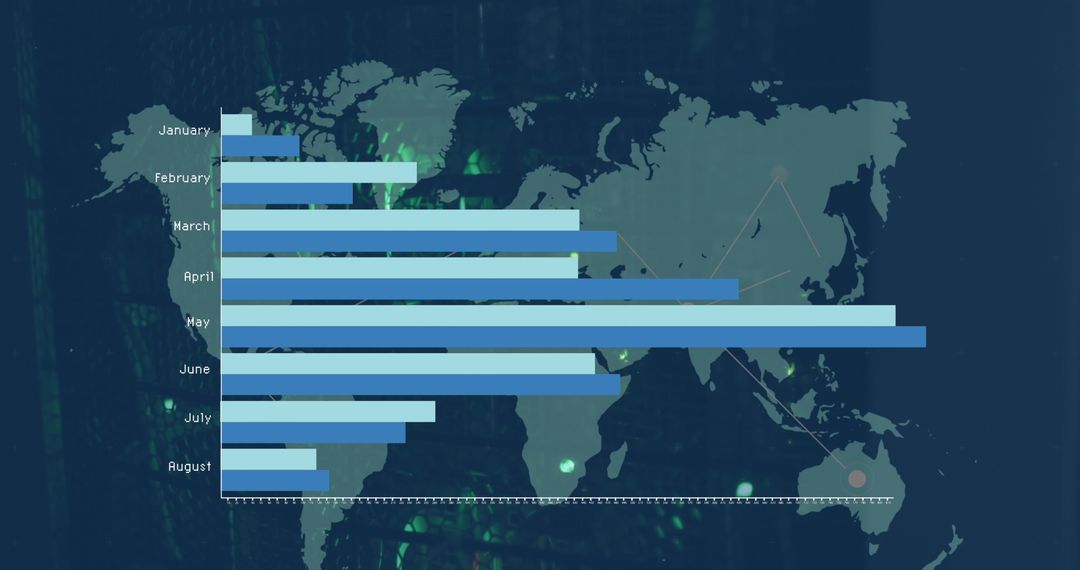
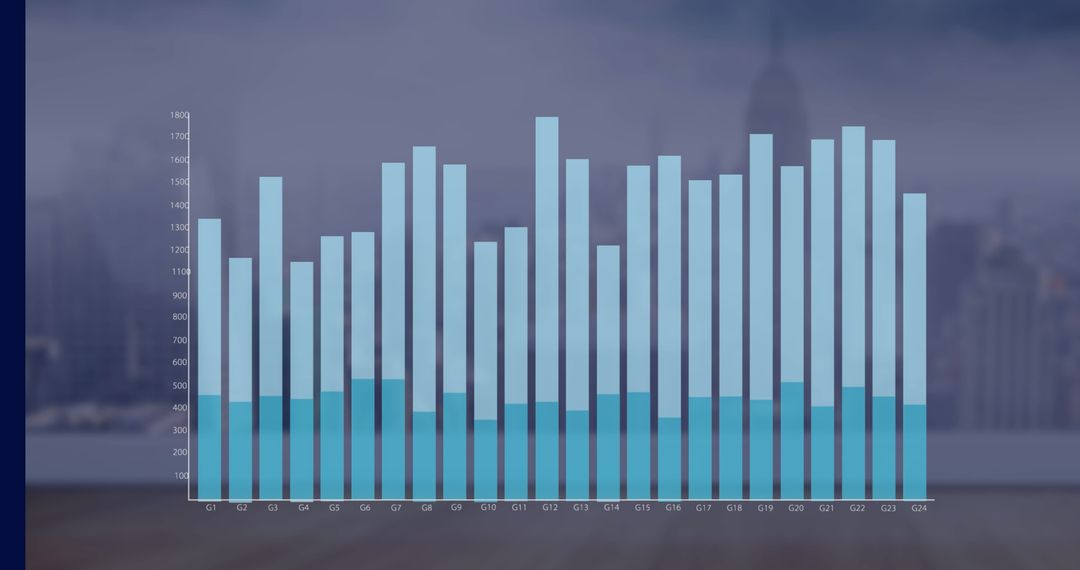
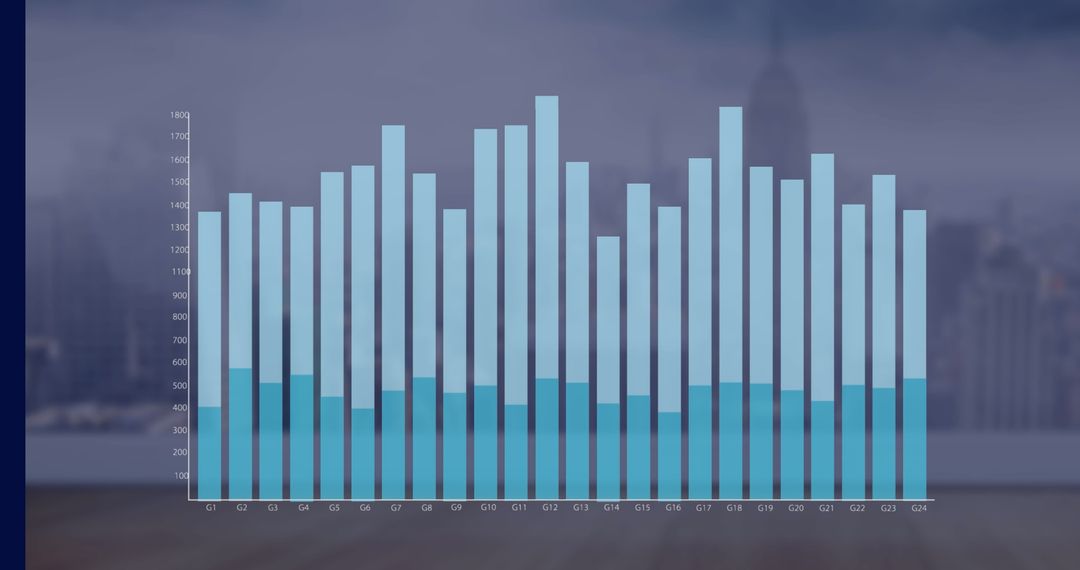
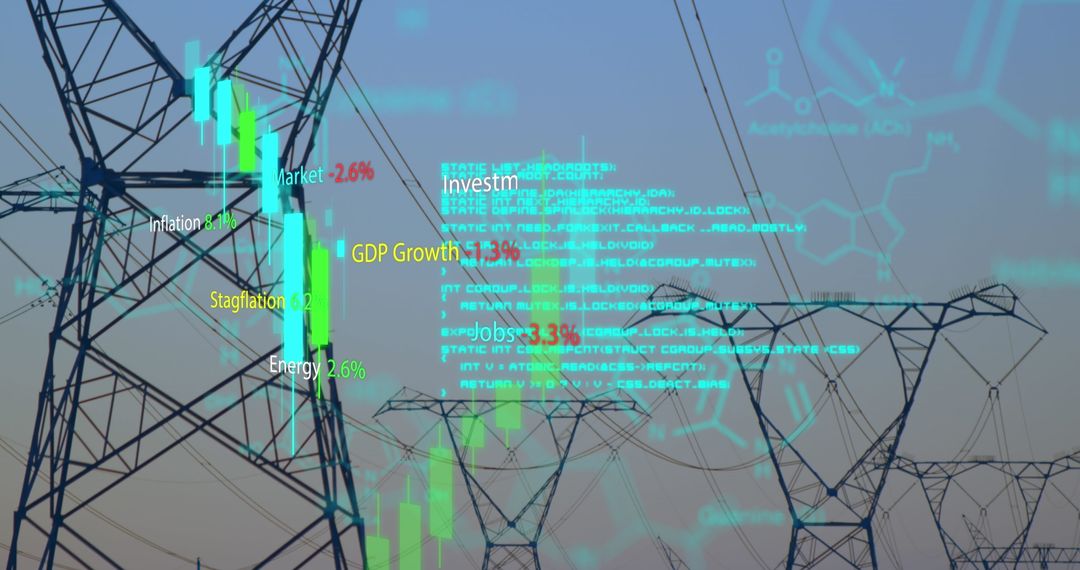
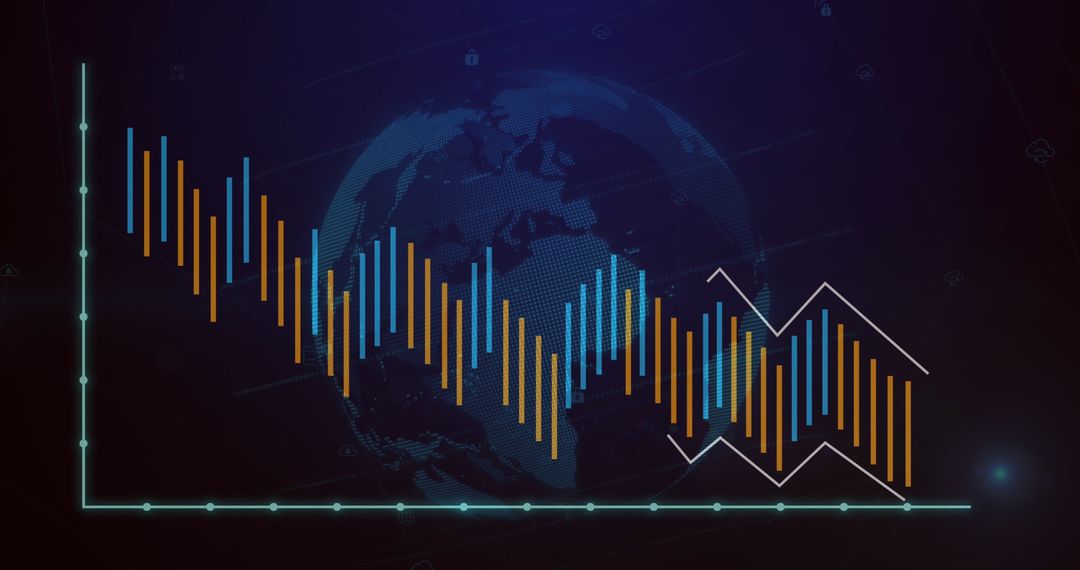
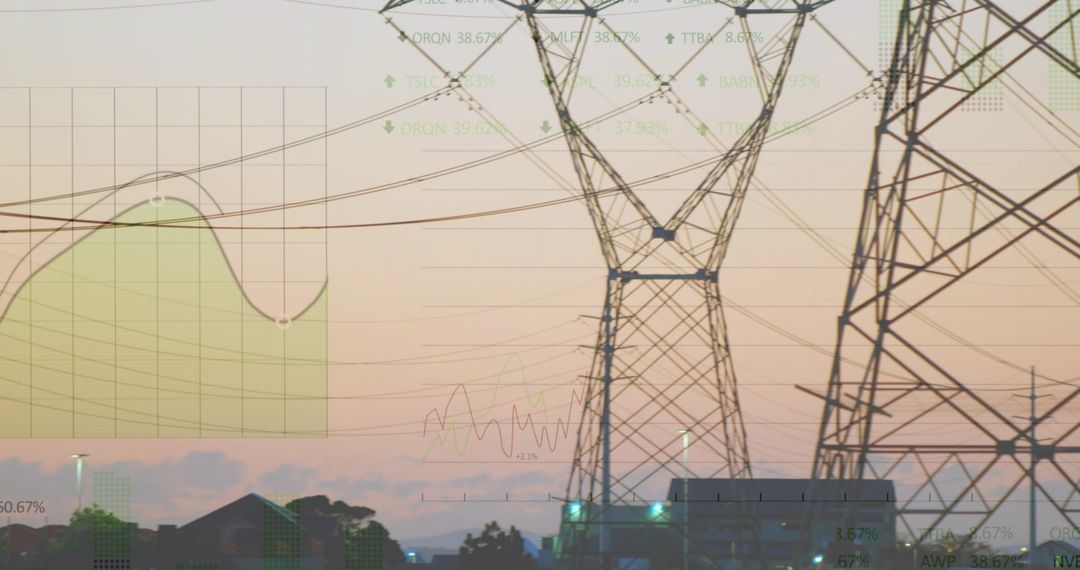
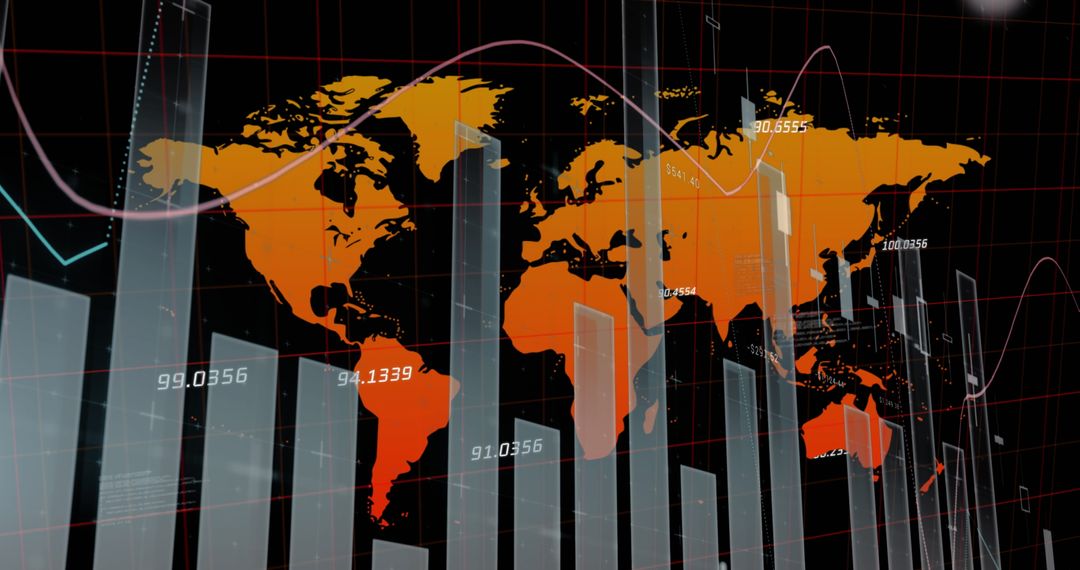
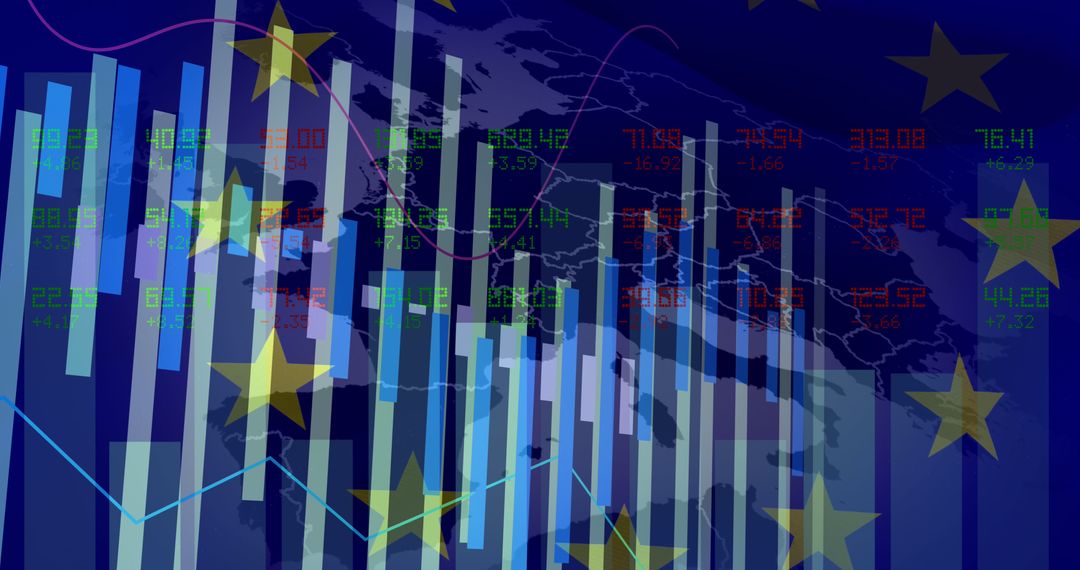
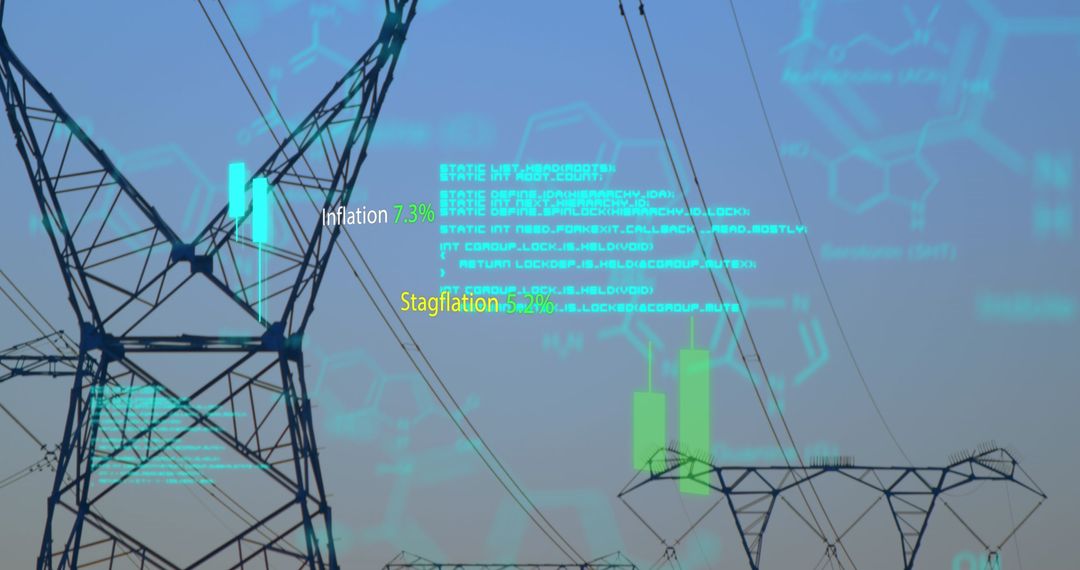
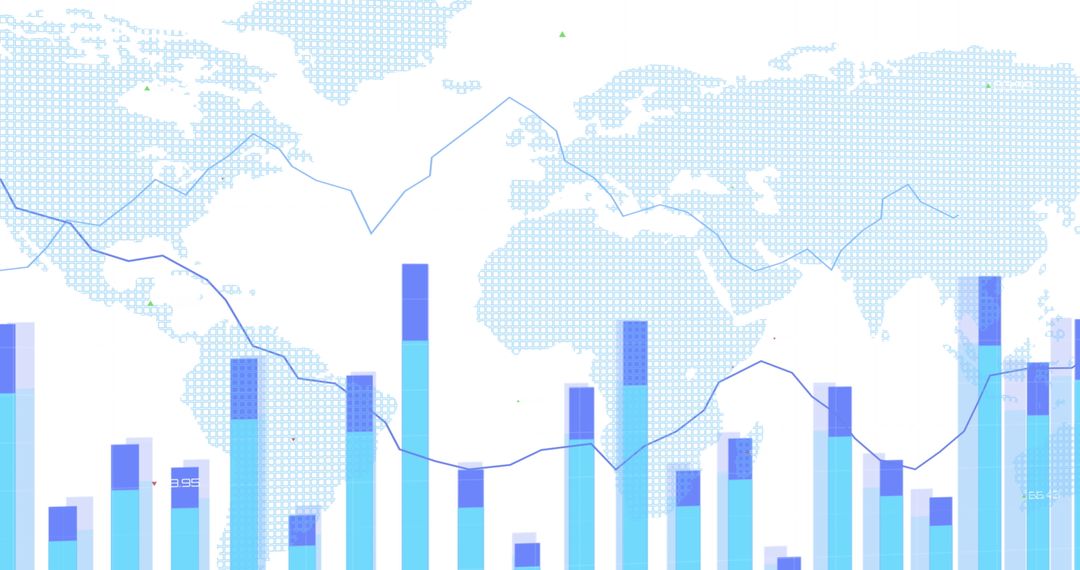
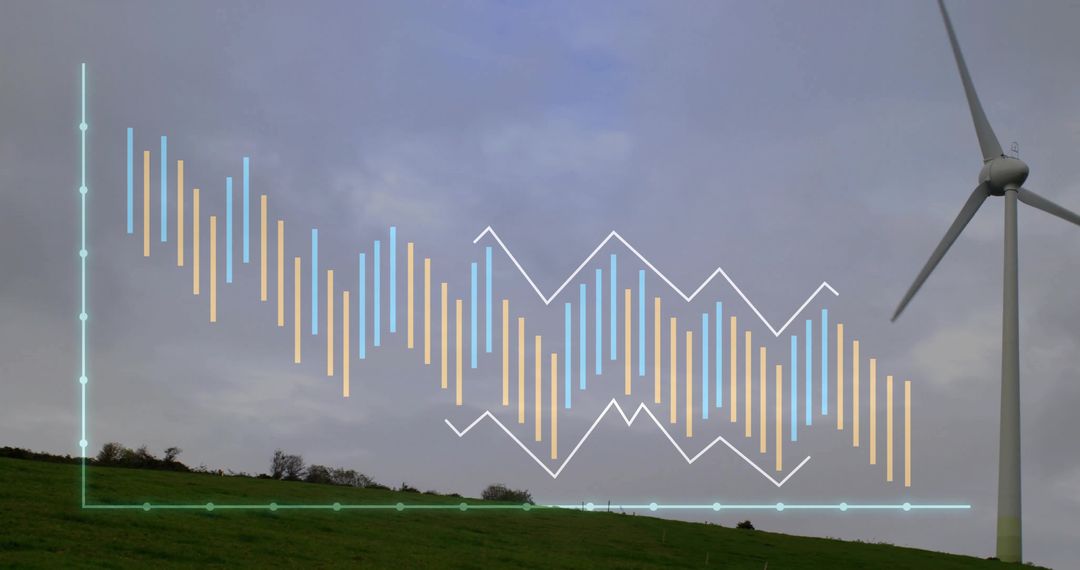
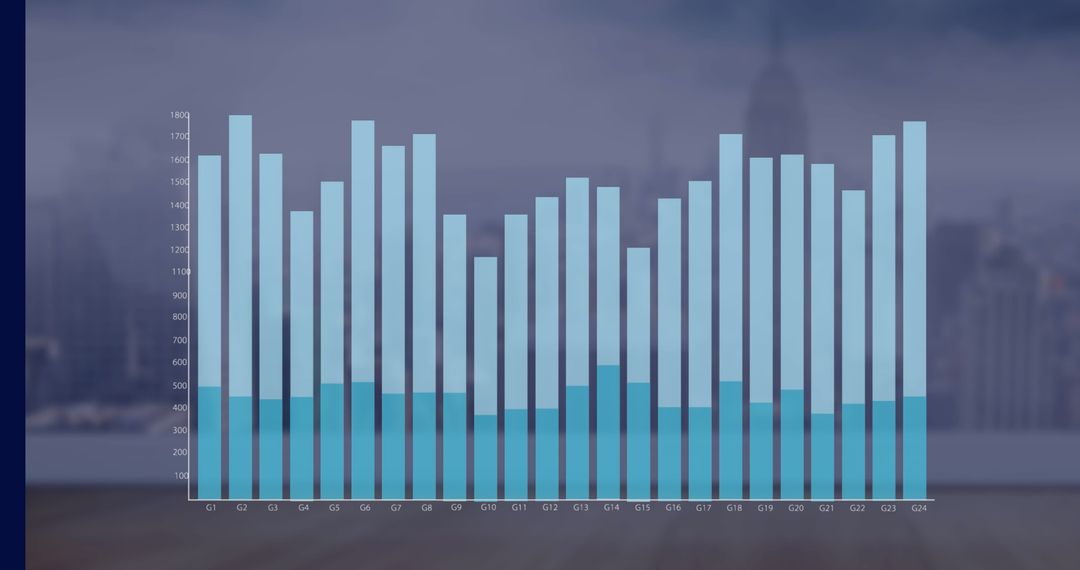
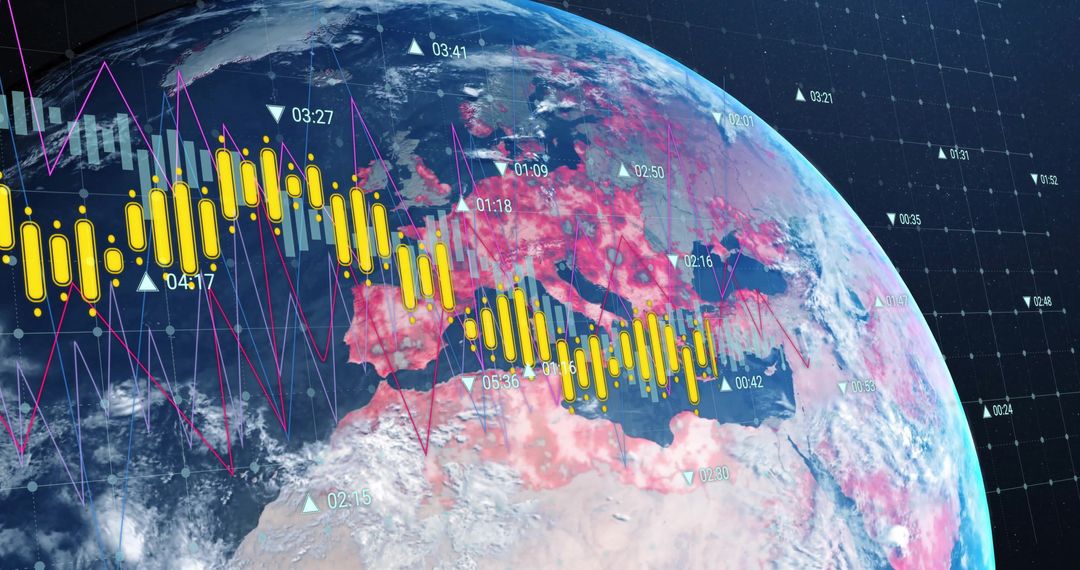
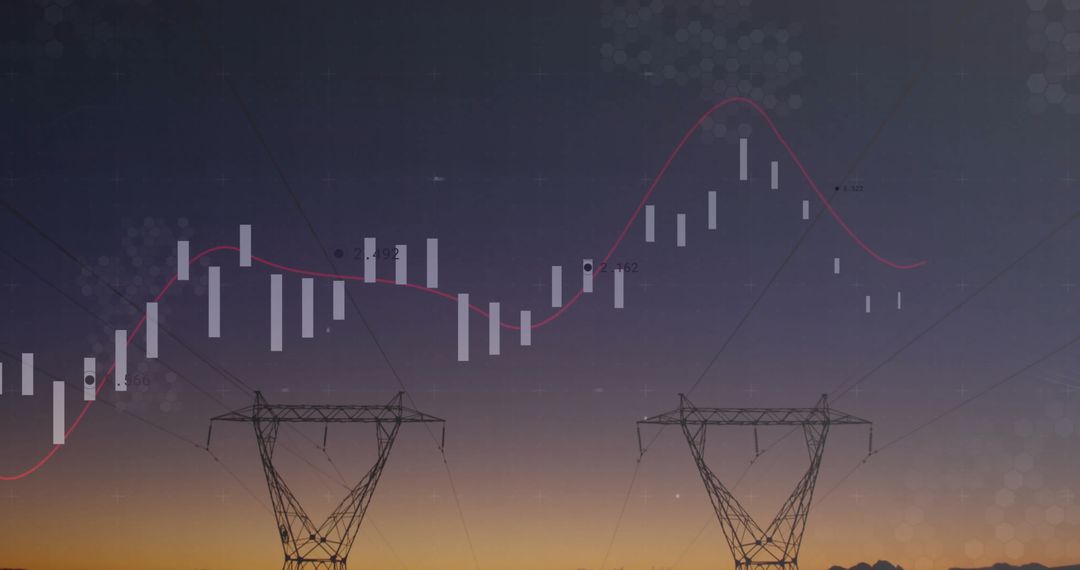
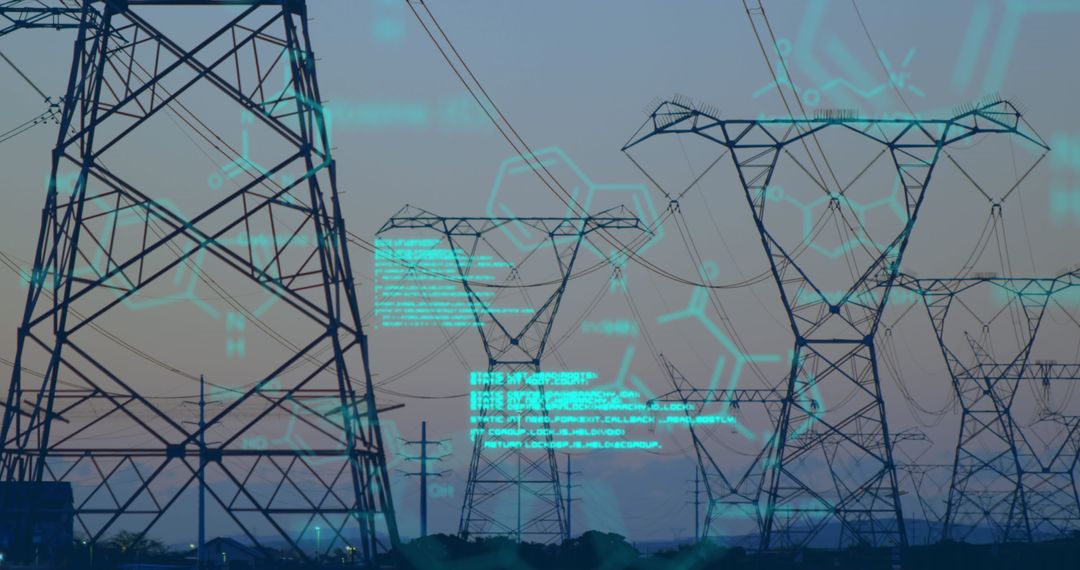
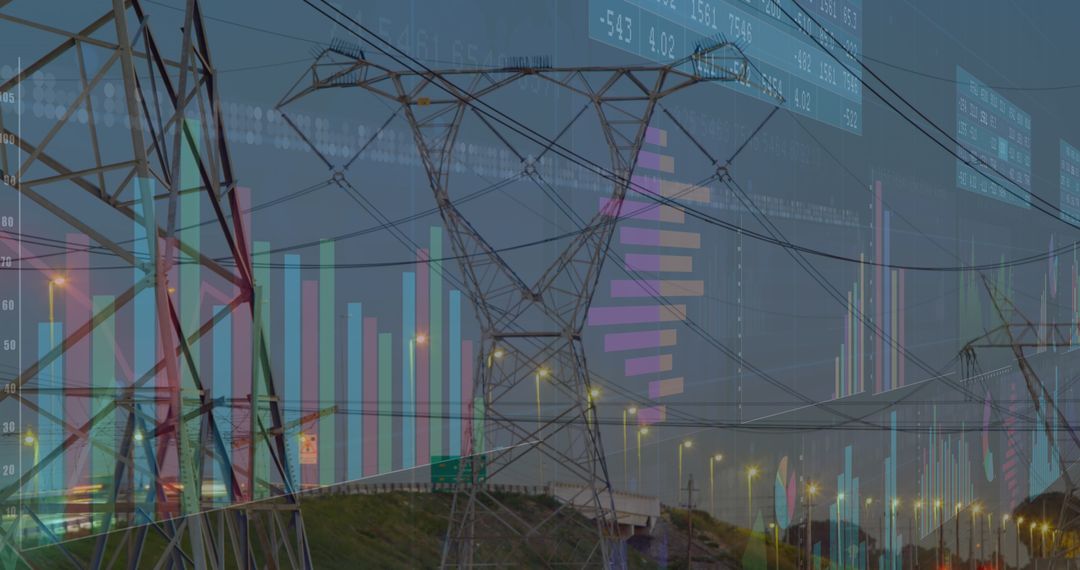
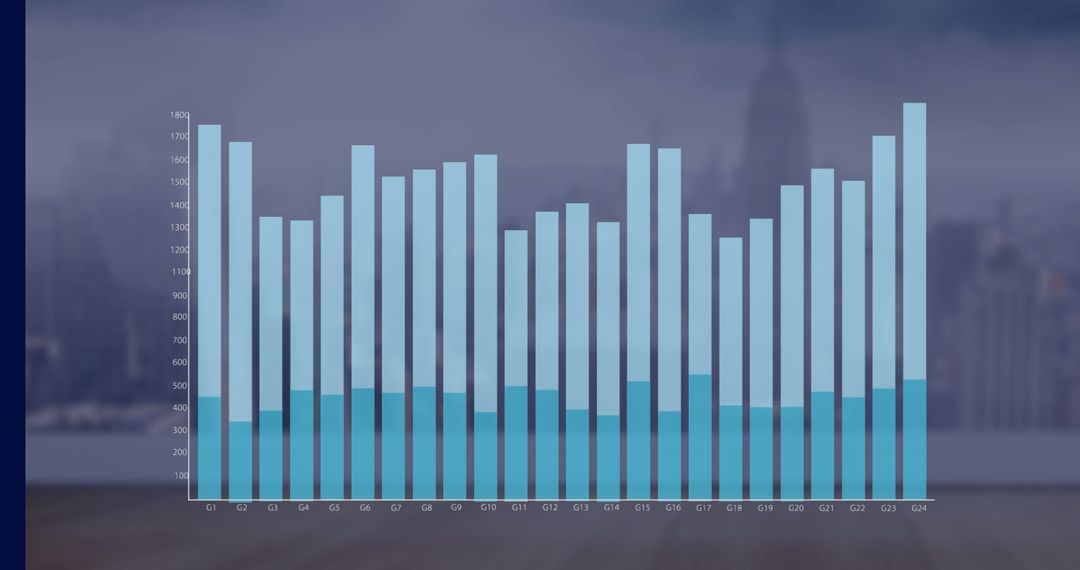
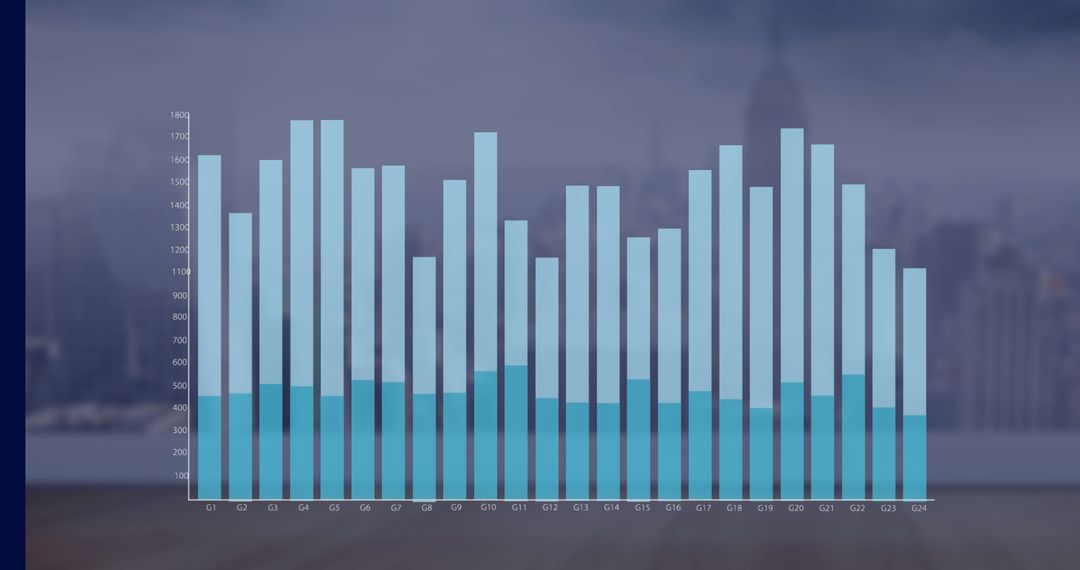
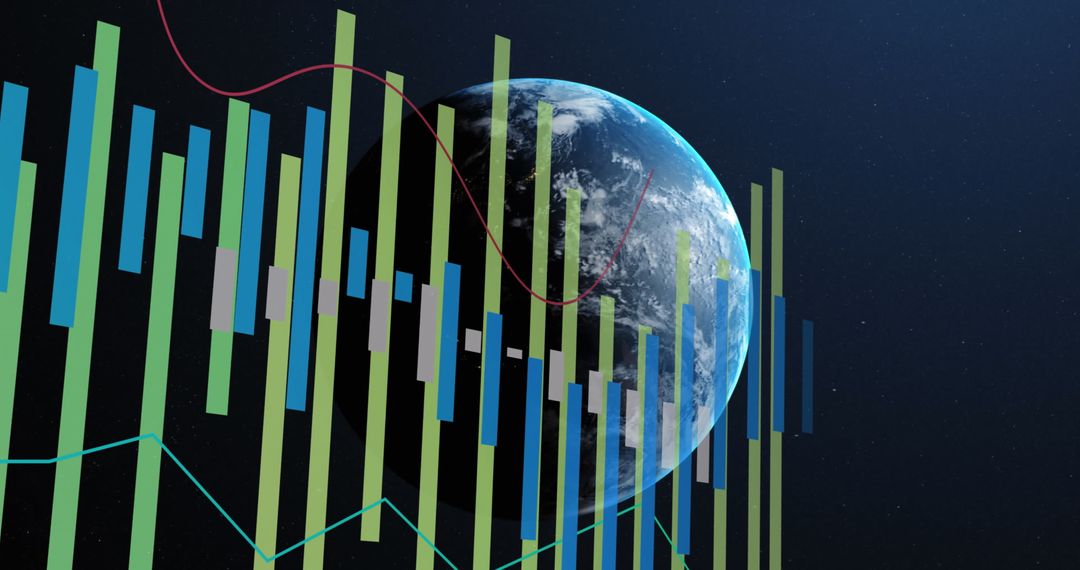
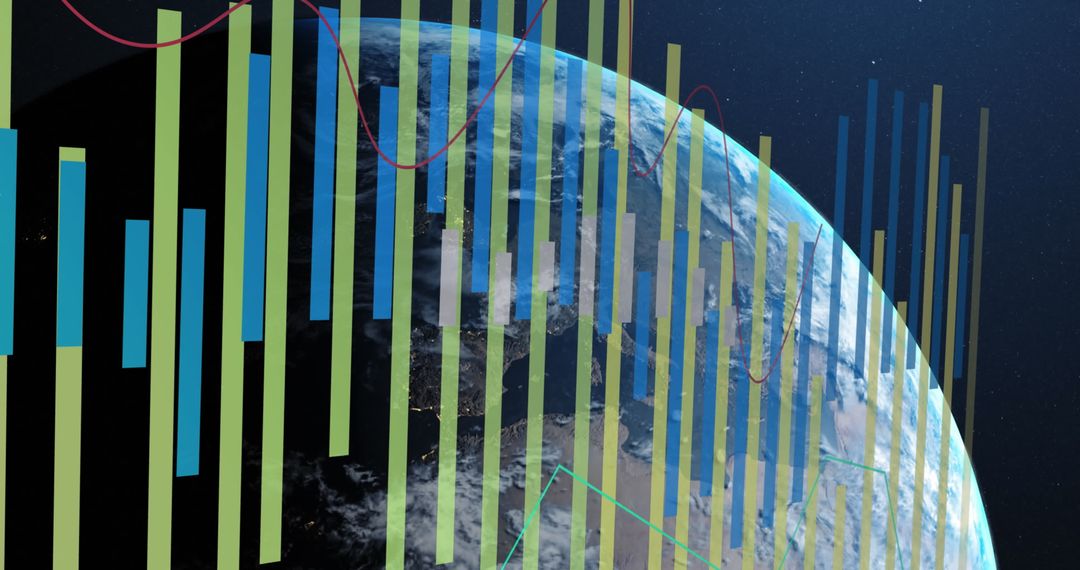
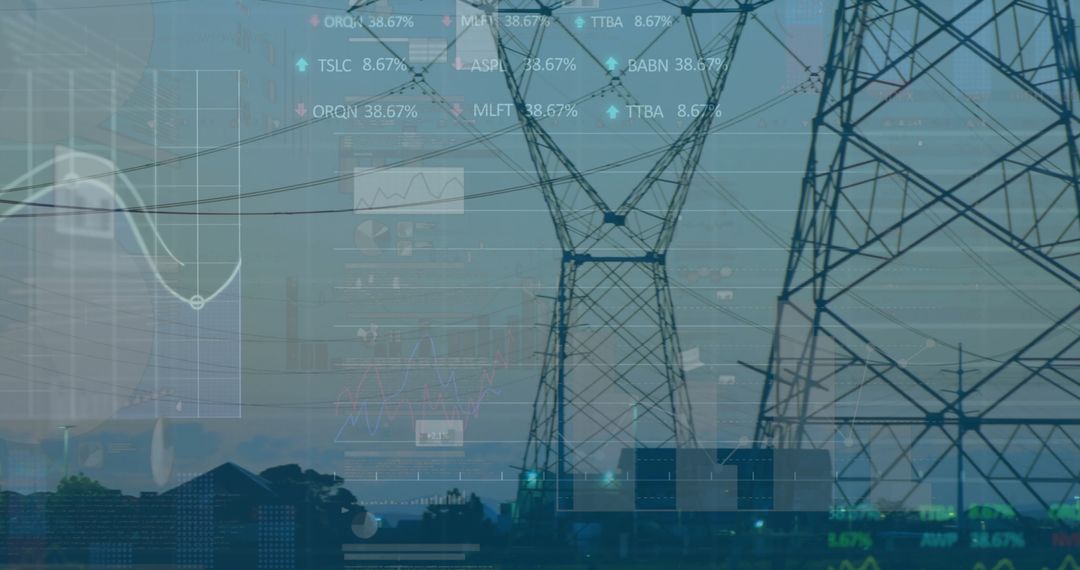
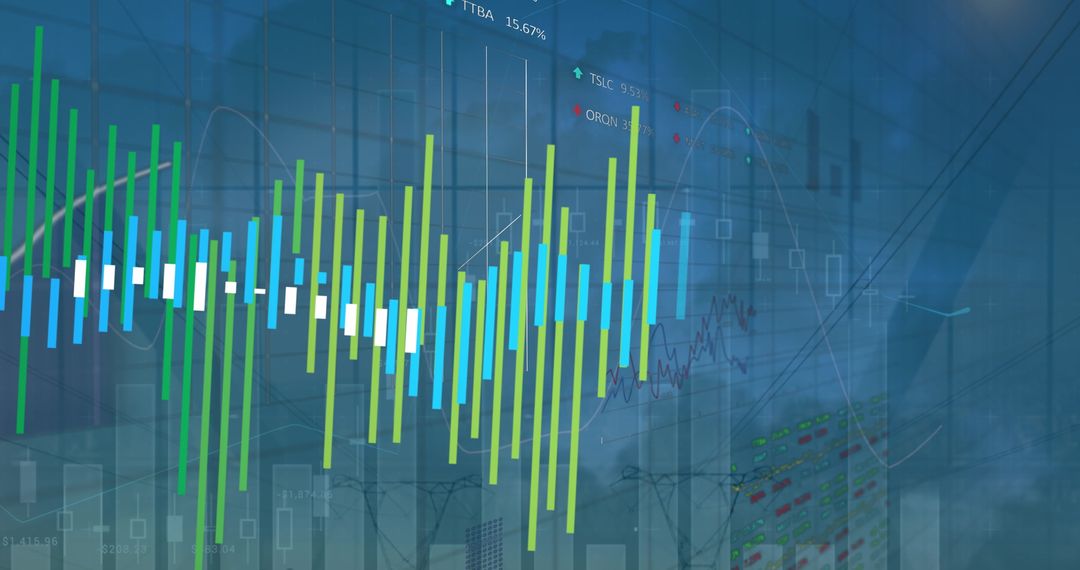
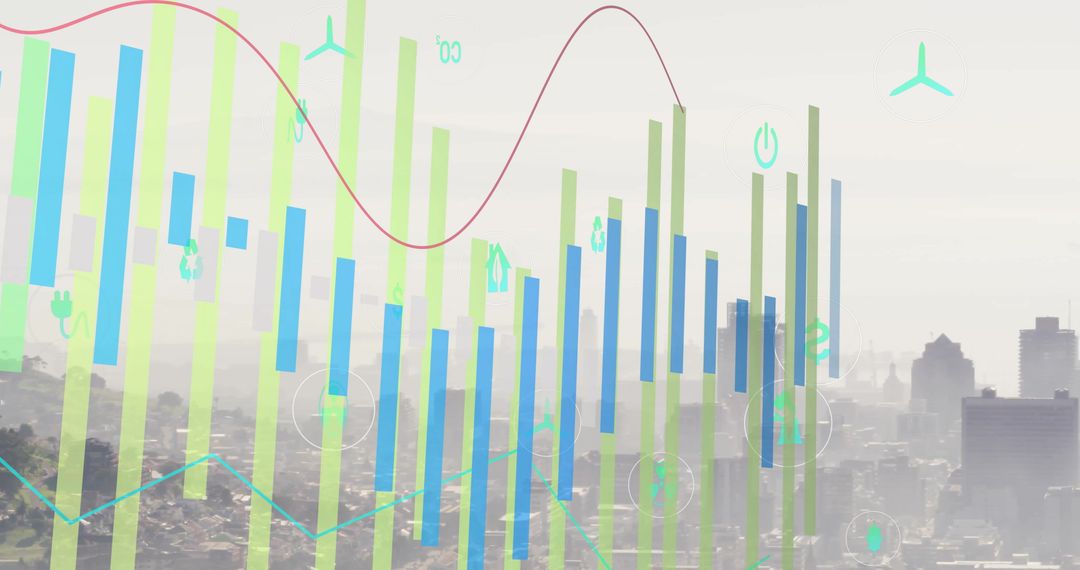
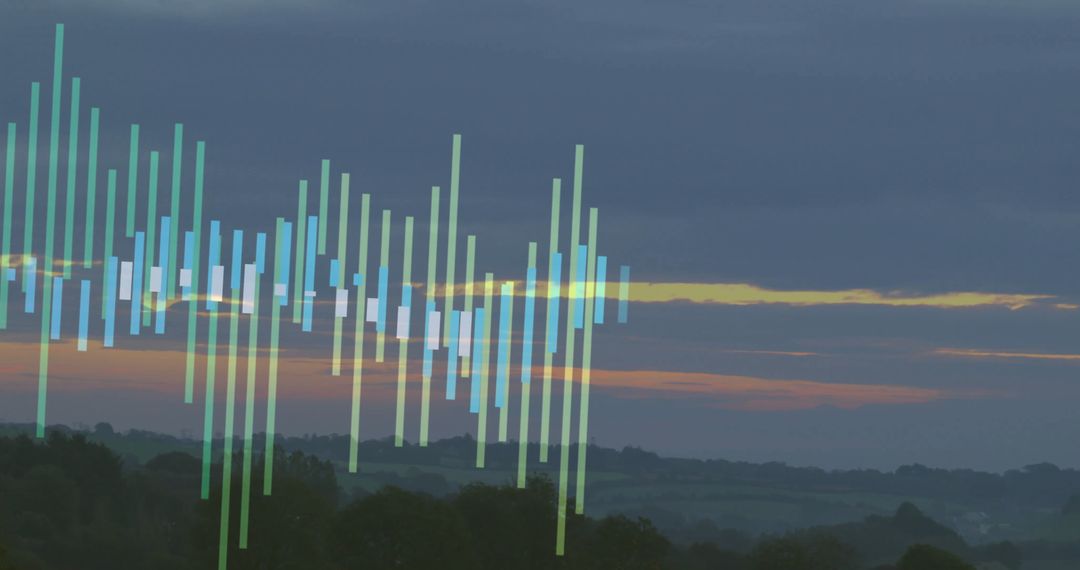
- European Map with Bar Chart Symbolizing Energy Economics
European Map with Bar Chart Symbolizing Energy Economics Image
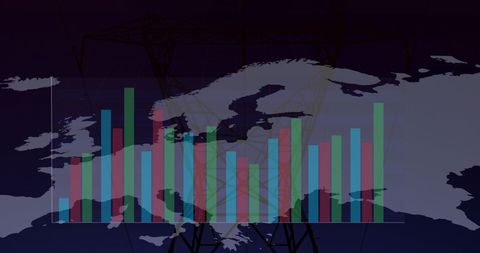
Visual displaying a map of Europe with an overlaid colorful bar chart. Conceptual combining geographical elements with economic data, highlighting energy flow interconnected with important matters in international undefined relations. Relevant in context with energy issues and geopolitical relationships????????.
Powered by  - Get 15% off with code: PIKWIZARD15


0
downloads
downloads
Credit Photo
If you would like to credit the Photo, here are some ways you can do so
Text Link
photo Link
<span class="text-link">
<span>
<a target="_blank" href=https://pikwizard.com/photo/european-map-with-bar-chart-symbolizing-energy-economics/4eb8c2468c1c7b4dd9cc46ec517dd72b/>PikWizard</a>
</span>
</span>
<span class="image-link">
<span
style="margin: 0 0 20px 0; display: inline-block; vertical-align: middle; width: 100%;"
>
<a
target="_blank"
href="https://pikwizard.com/photo/european-map-with-bar-chart-symbolizing-energy-economics/4eb8c2468c1c7b4dd9cc46ec517dd72b/"
style="text-decoration: none; font-size: 10px; margin: 0;"
>
<img src="https://pikwizard.com/pw/medium/4eb8c2468c1c7b4dd9cc46ec517dd72b.jpg" style="margin: 0; width: 100%;" alt="" />
<p style="font-size: 12px; margin: 0;">PikWizard</p>
</a>
</span>
</span>
Free (free of charge)
Free for personal and commercial use.
Author: People Creations
Similar Free Stock Images
Premium


Premium


Premium


Premium


Premium

Premium


Premium


Premium


Premium


Premium


Premium


Premium


Premium


Premium


Premium


Premium


Premium


Premium


Premium


Premium


Premium


Premium


Premium

Premium