
- Home >
- Stock Photos >
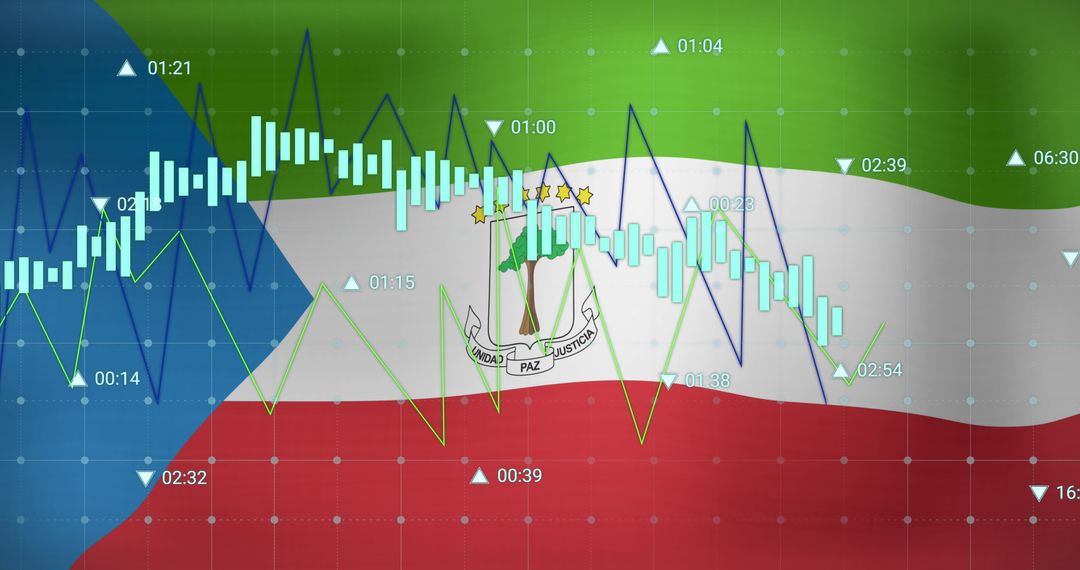
- European market candlestick chart showing volatility with EU stars overlay and time markers
European market candlestick chart showing volatility with EU stars overlay and time markers Image
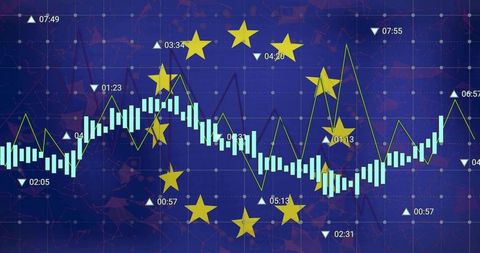
Dark blue financial grid featuring cyan candlesticks, green trend line, yellow EU stars, and timestamp markers, conveying European market movement and volatility. Composition highlighting data points and trend shifts with high contrast colors for clear legibility. Useful for illustrating EU economy coverage, market analysis, investment reports, trading platform interfaces, fintech presentations, and business news headers. Works well as hero banner, blog header, slide deck background, social media post, or infographic element. Crop-friendly for wide banners and thumbnails, leaving space for headline and overlay copy, and offering strong visual focus for charts and analytics.
Powered by 


0
downloads
downloads
Tags:
More
Credit Photo
If you would like to credit the Photo, here are some ways you can do so
Text Link
photo Link
<span class="text-link">
<span>
<a target="_blank" href=https://pikwizard.com/photo/european-market-candlestick-chart-showing-volatility-with-eu-stars-overlay-and-time-markers/351880ec3142832c59be16c621b6420e/>PikWizard</a>
</span>
</span>
<span class="image-link">
<span
style="margin: 0 0 20px 0; display: inline-block; vertical-align: middle; width: 100%;"
>
<a
target="_blank"
href="https://pikwizard.com/photo/european-market-candlestick-chart-showing-volatility-with-eu-stars-overlay-and-time-markers/351880ec3142832c59be16c621b6420e/"
style="text-decoration: none; font-size: 10px; margin: 0;"
>
<img src="https://pikwizard.com/pw/medium/351880ec3142832c59be16c621b6420e.jpg" style="margin: 0; width: 100%;" alt="" />
<p style="font-size: 12px; margin: 0;">PikWizard</p>
</a>
</span>
</span>
Free (free of charge)
Free for personal and commercial use.
Author: People Creations
Similar Free Stock Images

Premium


Premium


Premium


Premium


Premium


Premium


Premium


Premium


Premium


Premium


Premium


Premium


Premium


Premium


Premium


Premium


Premium


Premium


Premium


Premium


Premium


Premium


Premium


Premium

