
- Home >
- Stock Photos >
- European Union Financial Data Visualization with Analytics Integration
European Union Financial Data Visualization with Analytics Integration Image
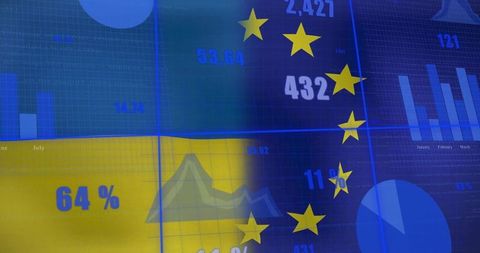
Graphical presentation merging imagery of EU flag with dynamic financial elements, including bar graphs, line charts, and pie chart statistics. Useful for illustrating articles on EU economic status, reports on financial trends within Europe, or technology's role in modern financial data interpretation. Ideal for business analytics demonstrations or educational material on European economics.

downloads
Tags:
More
Credit Photo
If you would like to credit the Photo, here are some ways you can do so
Text Link
photo Link
<span class="text-link">
<span>
<a target="_blank" href=https://pikwizard.com/photo/european-union-financial-data-visualization-with-analytics-integration/4cb2f1e5675766b33a60e0853f58b020/>PikWizard</a>
</span>
</span>
<span class="image-link">
<span
style="margin: 0 0 20px 0; display: inline-block; vertical-align: middle; width: 100%;"
>
<a
target="_blank"
href="https://pikwizard.com/photo/european-union-financial-data-visualization-with-analytics-integration/4cb2f1e5675766b33a60e0853f58b020/"
style="text-decoration: none; font-size: 10px; margin: 0;"
>
<img src="https://pikwizard.com/pw/medium/4cb2f1e5675766b33a60e0853f58b020.jpg" style="margin: 0; width: 100%;" alt="" />
<p style="font-size: 12px; margin: 0;">PikWizard</p>
</a>
</span>
</span>
Free (free of charge)
Free for personal and commercial use.
Author: Awesome Content