
- Home >
- Stock Photos >
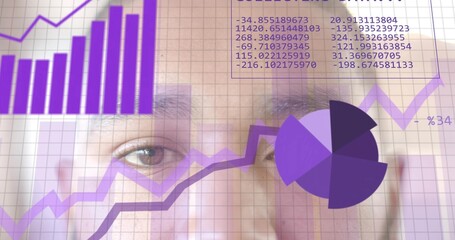
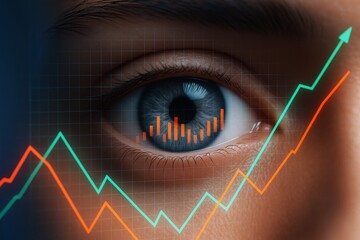
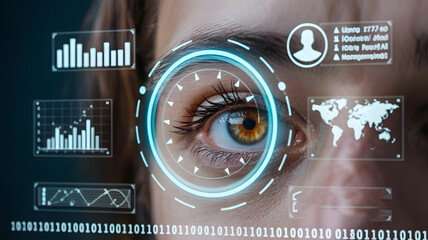
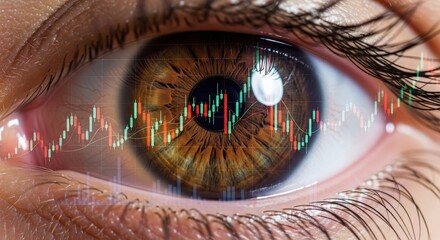
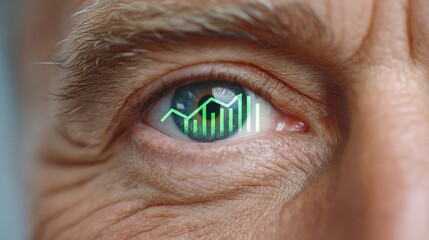
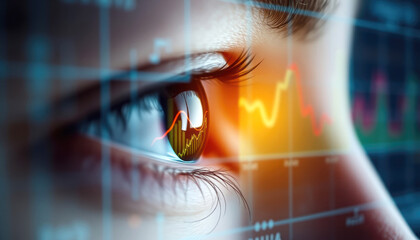
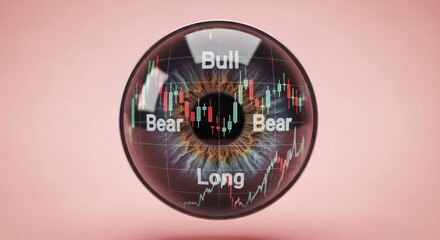
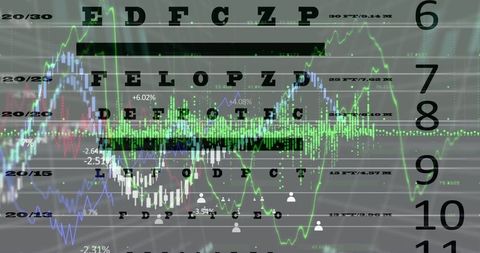
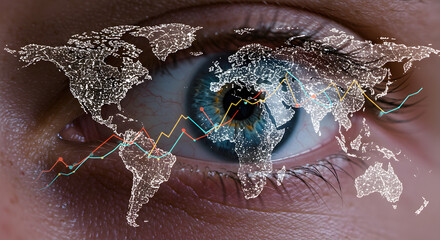
- Eye Chart with Digital Data Integration Visualizing Business Trends
Eye Chart with Digital Data Integration Visualizing Business Trends Image

Illustrating combined concepts of health optometry and business analytics, merging digital data graphs over a traditional eye chart, symbolizing measurement and evaluation. Useful for presentations on visual data interpretation, healthcare tech integration, or vision-related market analysis.
Powered by 


downloads
Tags:
More
Credit Photo
If you would like to credit the Photo, here are some ways you can do so
Text Link
photo Link
<span class="text-link">
<span>
<a target="_blank" href=https://pikwizard.com/photo/eye-chart-with-digital-data-integration-visualizing-business-trends/d0546f90fbf613f08416dff822c6d8c5/>PikWizard</a>
</span>
</span>
<span class="image-link">
<span
style="margin: 0 0 20px 0; display: inline-block; vertical-align: middle; width: 100%;"
>
<a
target="_blank"
href="https://pikwizard.com/photo/eye-chart-with-digital-data-integration-visualizing-business-trends/d0546f90fbf613f08416dff822c6d8c5/"
style="text-decoration: none; font-size: 10px; margin: 0;"
>
<img src="https://pikwizard.com/pw/medium/d0546f90fbf613f08416dff822c6d8c5.jpg" style="margin: 0; width: 100%;" alt="" />
<p style="font-size: 12px; margin: 0;">PikWizard</p>
</a>
</span>
</span>
Free (free of charge)
Free for personal and commercial use.
Author: Authentic Images
Similar Free Stock Images

Premium


Premium


Premium


Premium


Premium
Premium

Premium

Premium


Premium


Premium


Premium


Premium


Premium
Premium

Premium


Premium


Premium


Premium


Premium


Premium

Premium


Premium
Premium

Premium


Premium


Explore More Free Stock Images