- Home >
- Stock Photos >
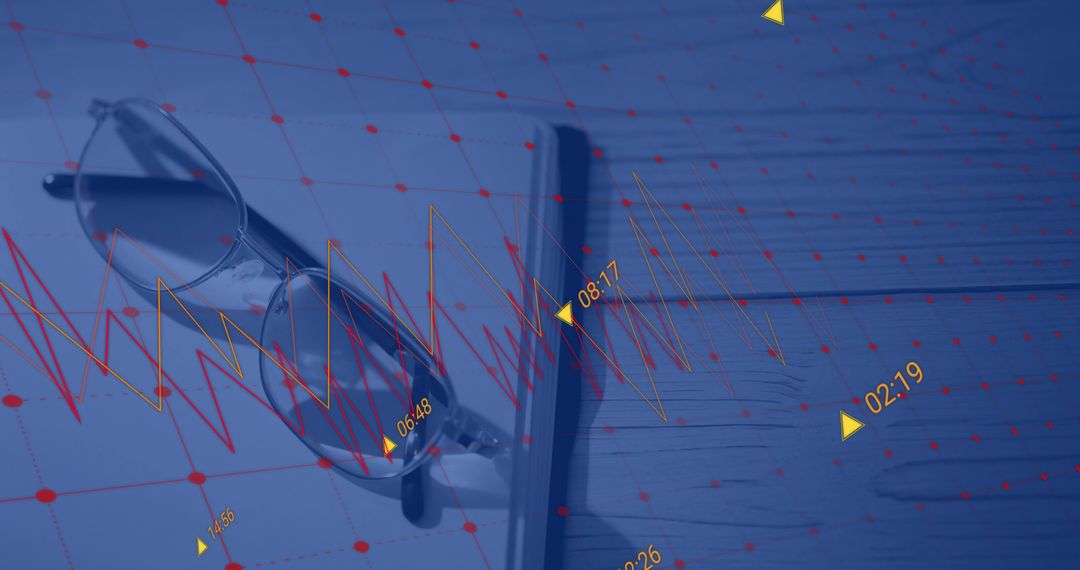
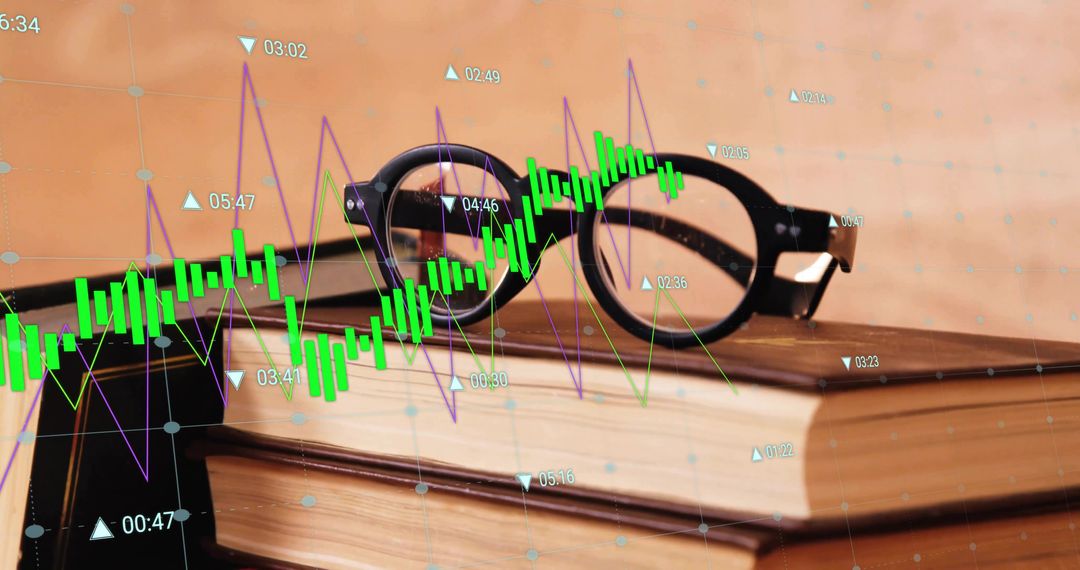
- Eyeglasses on Books with Stock Chart Overlays in Office Setting
Eyeglasses on Books with Stock Chart Overlays in Office Setting Image

This visual combines traditional learning elements with modern data analytics, reflecting a fusion of knowledge and technology. The overlay of stock charts suggests active engagement in financial analysis, making it suitable for materials related to data analytics, economic studies, financial advisories, or education sectors. Ideal for articles, presentations, or advertising focusing on finance, intellectual work, or professional settings.
Powered by 


0
downloads
downloads
Tags:
More
Credit Photo
If you would like to credit the Photo, here are some ways you can do so
Text Link
photo Link
<span class="text-link">
<span>
<a target="_blank" href=https://pikwizard.com/photo/eyeglasses-on-books-with-stock-chart-overlays-in-office-setting/3e6abcb76cbe0a98abd029660b000dcc/>PikWizard</a>
</span>
</span>
<span class="image-link">
<span
style="margin: 0 0 20px 0; display: inline-block; vertical-align: middle; width: 100%;"
>
<a
target="_blank"
href="https://pikwizard.com/photo/eyeglasses-on-books-with-stock-chart-overlays-in-office-setting/3e6abcb76cbe0a98abd029660b000dcc/"
style="text-decoration: none; font-size: 10px; margin: 0;"
>
<img src="https://pikwizard.com/pw/medium/3e6abcb76cbe0a98abd029660b000dcc.jpg" style="margin: 0; width: 100%;" alt="" />
<p style="font-size: 12px; margin: 0;">PikWizard</p>
</a>
</span>
</span>
Free (free of charge)
Free for personal and commercial use.
Author: People Creations
Similar Free Stock Images

Premium


Premium


Premium


Premium


Premium


Premium


Premium


Premium


Premium


Premium


Premium


Premium


Premium


Premium


Premium


Premium


Premium


Premium


Premium


Premium


Premium


Premium


Premium


Premium