
- Home >
- Stock Photos >
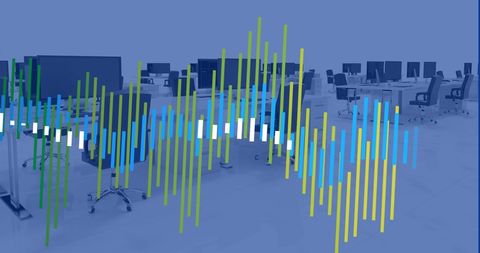
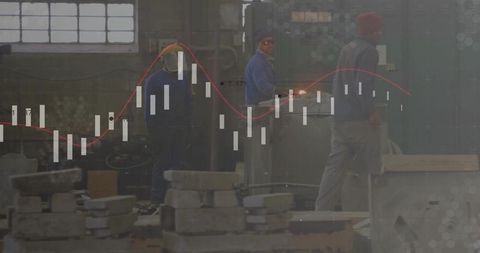
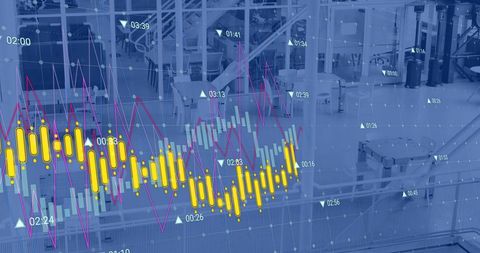
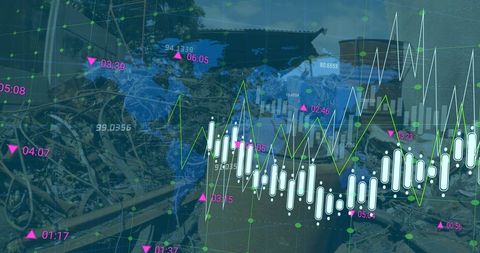
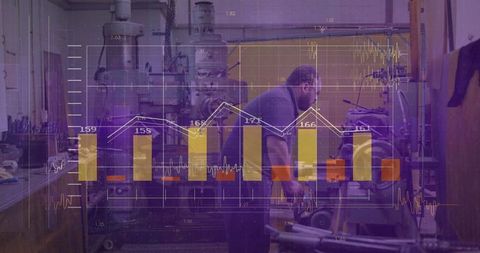
- Factory Worker Operating Control Panel With Overlaid Candlestick Charts and Data Analytics
Factory Worker Operating Control Panel With Overlaid Candlestick Charts and Data Analytics Image
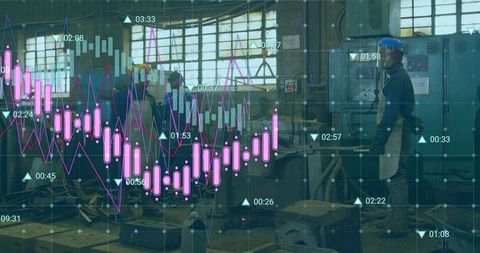
Showing industrial worker in helmet and apron operating control panel while overlaid candlestick charts and line graphs are conveying real-time analytics. Composition placing worker on right with open workshop background and ample copy space on left, making layout suitable for headline text, banner, or website hero. Ideal for manufacturing technology, industry 4.0, factory automation, predictive maintenance, industrial IoT, corporate report covers, marketing materials, and editorial on data-driven production. Color palette and graphical overlay creating modern tech mood for branding and presentation. Suggest cropping for header, placing headline in left copy space, using lower-third for subtitle, and adjusting overlay opacity for clear legibility.
Powered by 


downloads
Tags:
More
Credit Photo
If you would like to credit the Photo, here are some ways you can do so
Text Link
photo Link
<span class="text-link">
<span>
<a target="_blank" href=https://pikwizard.com/photo/factory-worker-operating-control-panel-with-overlaid-candlestick-charts-and-data-analytics/5a4179982c2bc2239e094abccca77b5c/>PikWizard</a>
</span>
</span>
<span class="image-link">
<span
style="margin: 0 0 20px 0; display: inline-block; vertical-align: middle; width: 100%;"
>
<a
target="_blank"
href="https://pikwizard.com/photo/factory-worker-operating-control-panel-with-overlaid-candlestick-charts-and-data-analytics/5a4179982c2bc2239e094abccca77b5c/"
style="text-decoration: none; font-size: 10px; margin: 0;"
>
<img src="https://pikwizard.com/pw/medium/5a4179982c2bc2239e094abccca77b5c.jpg" style="margin: 0; width: 100%;" alt="" />
<p style="font-size: 12px; margin: 0;">PikWizard</p>
</a>
</span>
</span>
Free (free of charge)
Free for personal and commercial use.
Author: People Creations
Similar Free Stock Images

Premium


Premium

Premium


Premium


Premium


Premium


Premium


Premium


Premium


Premium


Premium


Premium


Premium


Premium


Premium


Premium


Premium

Premium

Premium


Premium

Premium


Premium


Premium

Premium


Premium


Explore More Free Stock Images