
- Home >
- Stock Photos >
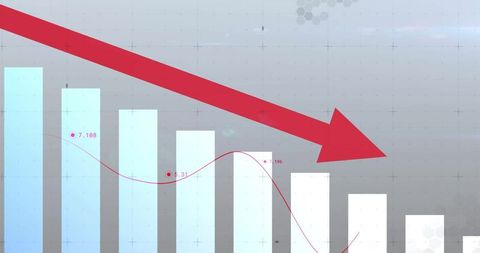
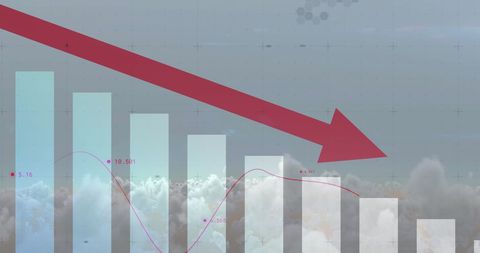
- Falling Bar Graph and Bubbles on Digital Interface
Falling Bar Graph and Bubbles on Digital Interface Image

Abstract concept of data analysis and economic downturn. Useful for illustrating financial loss, market analytics, or technology-related presentations and publications.
Powered by 


downloads
Tags:
More
Credit Photo
If you would like to credit the Photo, here are some ways you can do so
Text Link
photo Link
<span class="text-link">
<span>
<a target="_blank" href=https://pikwizard.com/photo/falling-bar-graph-and-bubbles-on-digital-interface/37472b54a217f92d1d19d7dc7dc0bd86/>PikWizard</a>
</span>
</span>
<span class="image-link">
<span
style="margin: 0 0 20px 0; display: inline-block; vertical-align: middle; width: 100%;"
>
<a
target="_blank"
href="https://pikwizard.com/photo/falling-bar-graph-and-bubbles-on-digital-interface/37472b54a217f92d1d19d7dc7dc0bd86/"
style="text-decoration: none; font-size: 10px; margin: 0;"
>
<img src="https://pikwizard.com/pw/medium/37472b54a217f92d1d19d7dc7dc0bd86.jpg" style="margin: 0; width: 100%;" alt="" />
<p style="font-size: 12px; margin: 0;">PikWizard</p>
</a>
</span>
</span>
Free (free of charge)
Free for personal and commercial use.
Author: Awesome Content
Similar Free Stock Images

Premium


Premium


Premium


Premium

Premium


Premium


Premium


Premium

Premium


Premium


Premium


Premium


Premium


Premium

Premium


Premium


Premium

Premium

Premium


Premium


Premium


Premium

Premium


Premium


Premium


Explore More Free Stock Images