
- Home >
- Stock Photos >
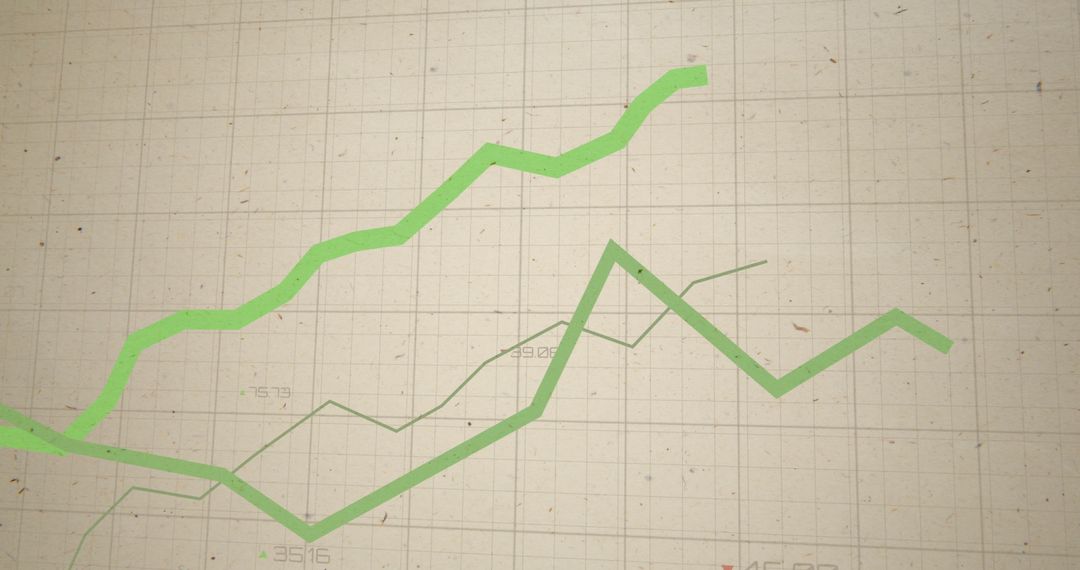
- Falling Line Graph Illustrates Decreasing Financial Trends
Falling Line Graph Illustrates Decreasing Financial Trends Image

The visual overlays a red line graph with falling trends on a grid background, symbolizing declining financials or market downturns. Suitable for illustrating concepts like economic slowdown, investment analysis, and business reports. Ideal for financial presentations, news articles, and economic studies to convey shifting market conditions.
Powered by  - Get 15% off with code: PIKWIZARD15


2
downloads
downloads
Tags:
More
Credit Photo
If you would like to credit the Photo, here are some ways you can do so
Text Link
photo Link
<span class="text-link">
<span>
<a target="_blank" href=https://pikwizard.com/photo/falling-line-graph-illustrates-decreasing-financial-trends/82df3ff8cc88f3090e193923799acc9f/>PikWizard</a>
</span>
</span>
<span class="image-link">
<span
style="margin: 0 0 20px 0; display: inline-block; vertical-align: middle; width: 100%;"
>
<a
target="_blank"
href="https://pikwizard.com/photo/falling-line-graph-illustrates-decreasing-financial-trends/82df3ff8cc88f3090e193923799acc9f/"
style="text-decoration: none; font-size: 10px; margin: 0;"
>
<img src="https://pikwizard.com/pw/medium/82df3ff8cc88f3090e193923799acc9f.jpg" style="margin: 0; width: 100%;" alt="" />
<p style="font-size: 12px; margin: 0;">PikWizard</p>
</a>
</span>
</span>
Free (free of charge)
Free for personal and commercial use.
Author: Creative Art
Similar Free Stock Images

Premium


Premium


Premium


Premium


Premium


Premium


Premium


Premium


Premium


Premium


Premium


Premium


Premium


Premium


Premium


Premium


Premium


Premium


Premium


Premium


Premium


Premium


Premium


Premium

