- Home >
- Stock Photos >
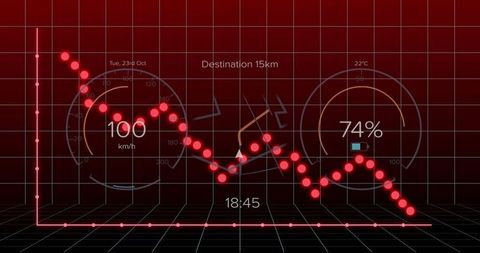
- Falling Line Graph with Red Data Markers in Digital Interface
Falling Line Graph with Red Data Markers in Digital Interface Image

This visualization of a falling line graph with red circular data markers against a grid background is perfect for presentations or reports on financial trends and data analytics. It can illustrate concepts of market decline in investment presentations or enhance content in data science courses about visual data interpretation, providing a digital and modern aesthetic.
Powered by 


downloads
Tags:
More
Credit Photo
If you would like to credit the Photo, here are some ways you can do so
Text Link
photo Link
<span class="text-link">
<span>
<a target="_blank" href=https://pikwizard.com/photo/falling-line-graph-with-red-data-markers-in-digital-interface/e42b28ed8c6f6d78ec945218843b4e16/>PikWizard</a>
</span>
</span>
<span class="image-link">
<span
style="margin: 0 0 20px 0; display: inline-block; vertical-align: middle; width: 100%;"
>
<a
target="_blank"
href="https://pikwizard.com/photo/falling-line-graph-with-red-data-markers-in-digital-interface/e42b28ed8c6f6d78ec945218843b4e16/"
style="text-decoration: none; font-size: 10px; margin: 0;"
>
<img src="https://pikwizard.com/pw/medium/e42b28ed8c6f6d78ec945218843b4e16.jpg" style="margin: 0; width: 100%;" alt="" />
<p style="font-size: 12px; margin: 0;">PikWizard</p>
</a>
</span>
</span>
Free (free of charge)
Free for personal and commercial use.
Author: Awesome Content