
- Home >
- Stock Photos >
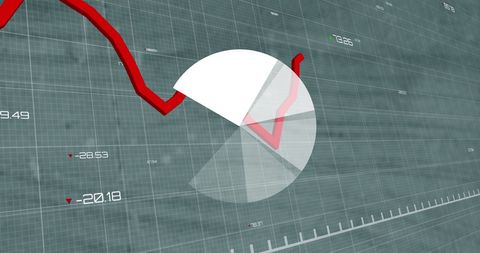
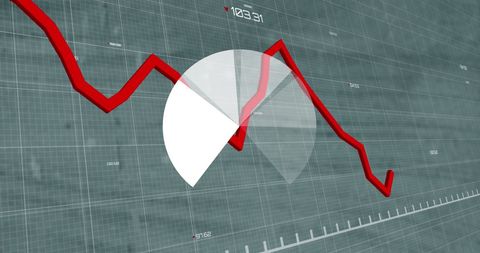
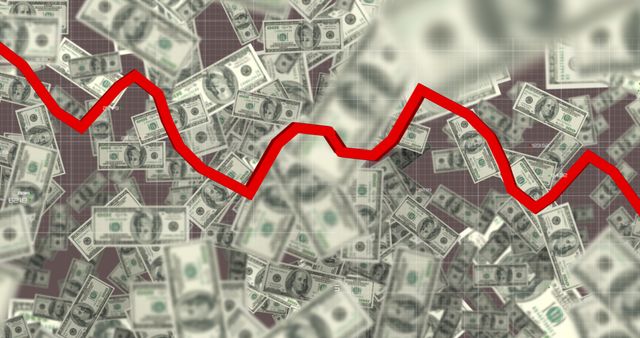
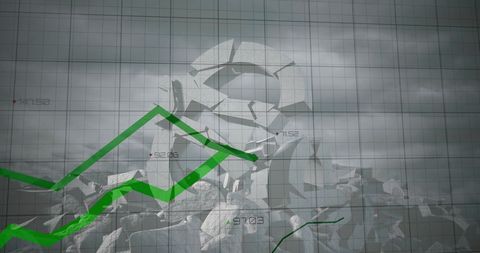
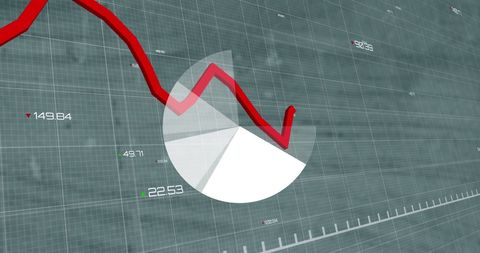
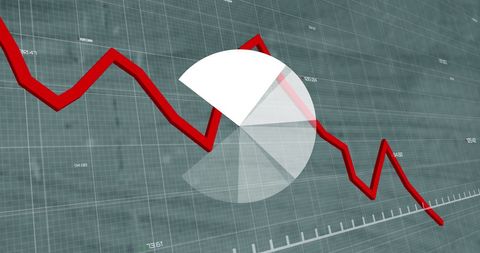
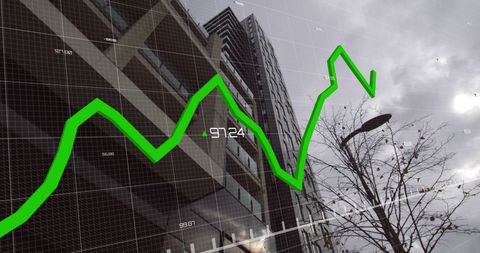
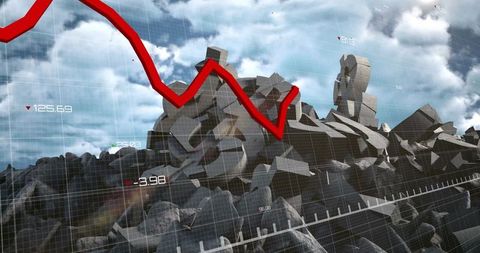
- Falling Market Graph Overlaid on Euro Banknotes and Burning Sparks
Falling Market Graph Overlaid on Euro Banknotes and Burning Sparks Image

Dynamic visualization shows red graph indicating declining market overlaying euro banknotes with fiery sparks, symbolizing economic challenges and volatility. Ideal for illustrating financial articles, presentations, or educational content discussing market trends or economic decline within the European context.
Powered by  - Get 15% off with code: PIKWIZARD15


downloads
Tags:
More
Credit Photo
If you would like to credit the Photo, here are some ways you can do so
Text Link
photo Link
<span class="text-link">
<span>
<a target="_blank" href=https://pikwizard.com/photo/falling-market-graph-overlaid-on-euro-banknotes-and-burning-sparks/fb5ee328b3d212e5a0984388167f61b4/>PikWizard</a>
</span>
</span>
<span class="image-link">
<span
style="margin: 0 0 20px 0; display: inline-block; vertical-align: middle; width: 100%;"
>
<a
target="_blank"
href="https://pikwizard.com/photo/falling-market-graph-overlaid-on-euro-banknotes-and-burning-sparks/fb5ee328b3d212e5a0984388167f61b4/"
style="text-decoration: none; font-size: 10px; margin: 0;"
>
<img src="https://pikwizard.com/pw/medium/fb5ee328b3d212e5a0984388167f61b4.jpg" style="margin: 0; width: 100%;" alt="" />
<p style="font-size: 12px; margin: 0;">PikWizard</p>
</a>
</span>
</span>
Free (free of charge)
Free for personal and commercial use.
Author: Authentic Images
Similar Free Stock Images
Loading...

Premium


Premium

Premium

Premium


Premium

Premium


Premium


Premium


Premium

Premium

Premium


Premium

Premium

Premium


Premium


Premium


Premium

Premium

Premium


Premium


Premium

Premium


Premium


Premium


Premium


Explore More Free Stock Images