- Home >
- Stock Photos >
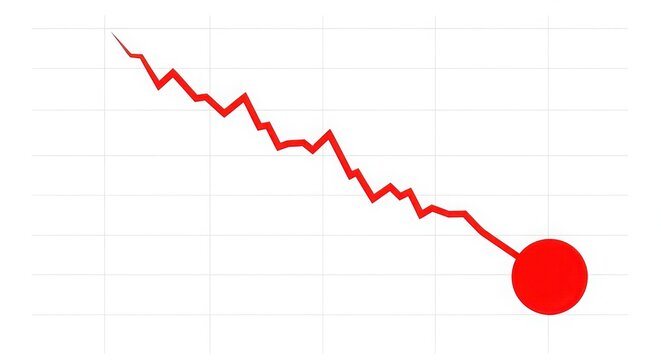
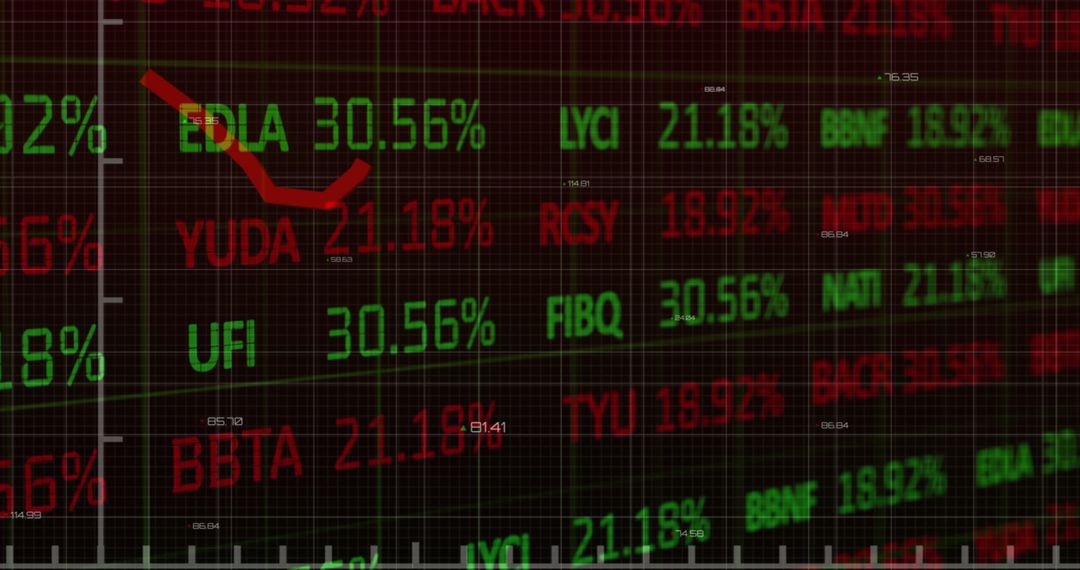
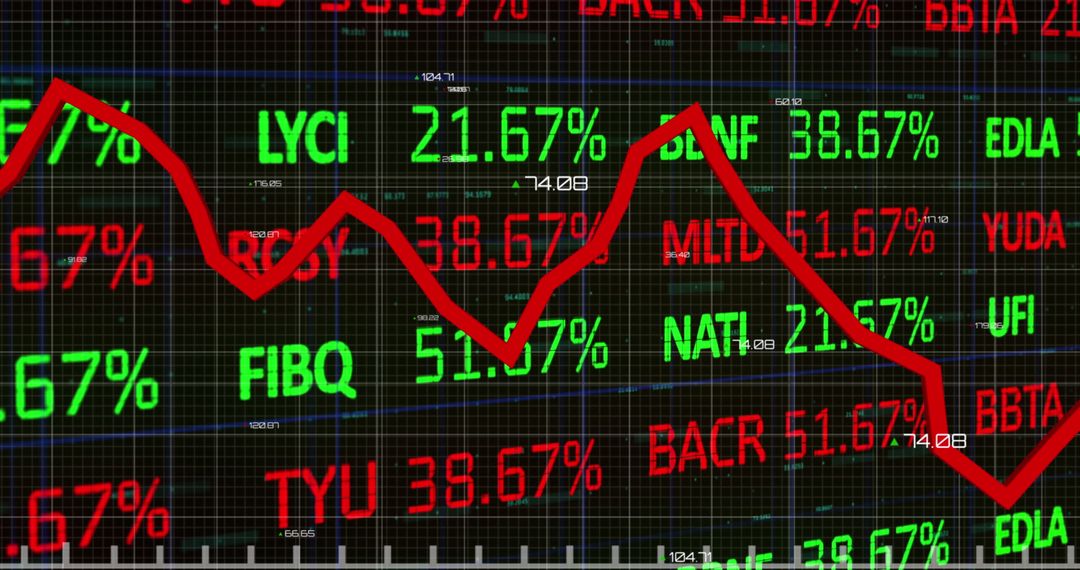
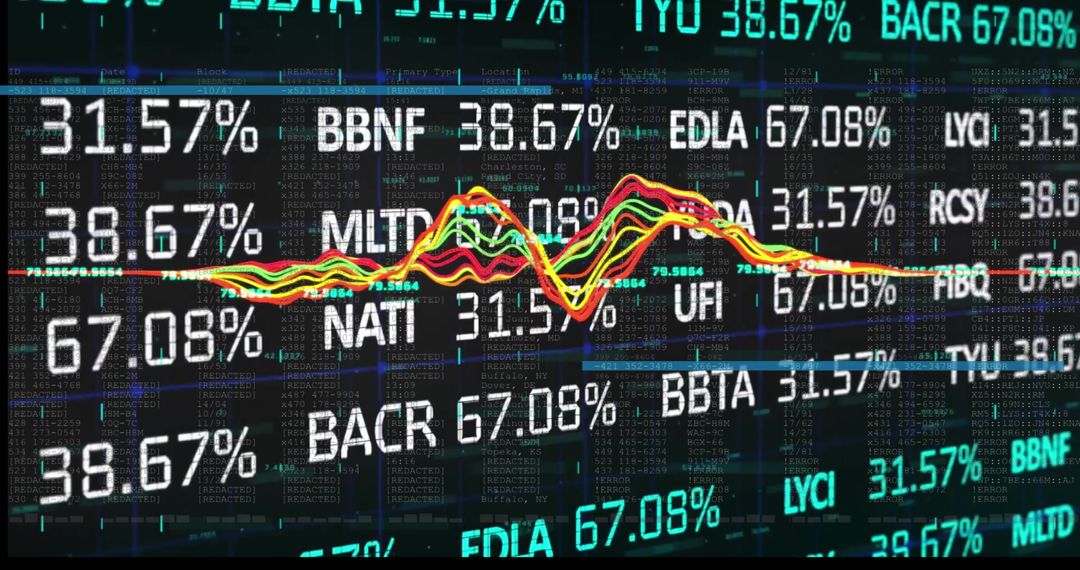
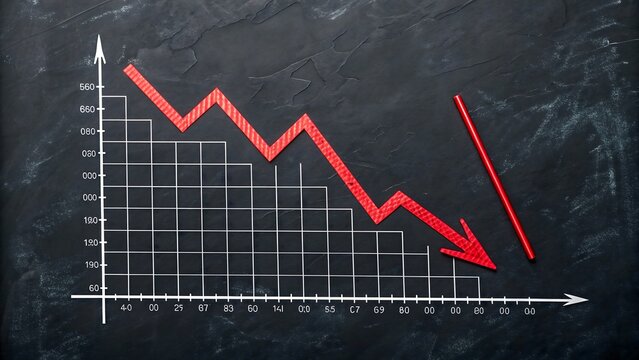
- Falling Red Line on Global Stock Market Display
Falling Red Line on Global Stock Market Display Image

Digital graph showcases downward trend on stock market display, reflecting global economic shifts. Useful for articles on financial analysis, market fluctuation insights, or visual aids in finance presentations highlighting economic uncertainty.
Powered by 


4
downloads
downloads
Tags:
More
Credit Photo
If you would like to credit the Photo, here are some ways you can do so
Text Link
photo Link
<span class="text-link">
<span>
<a target="_blank" href=https://pikwizard.com/photo/falling-red-line-on-global-stock-market-display/ce2ab6e7639ed6d6d0961c69b481d3a1/>PikWizard</a>
</span>
</span>
<span class="image-link">
<span
style="margin: 0 0 20px 0; display: inline-block; vertical-align: middle; width: 100%;"
>
<a
target="_blank"
href="https://pikwizard.com/photo/falling-red-line-on-global-stock-market-display/ce2ab6e7639ed6d6d0961c69b481d3a1/"
style="text-decoration: none; font-size: 10px; margin: 0;"
>
<img src="https://pikwizard.com/pw/medium/ce2ab6e7639ed6d6d0961c69b481d3a1.jpg" style="margin: 0; width: 100%;" alt="" />
<p style="font-size: 12px; margin: 0;">PikWizard</p>
</a>
</span>
</span>
Free (free of charge)
Free for personal and commercial use.
Author: Creative Art
Similar Free Stock Images

Premium


Premium


Premium


Premium


Premium


Premium


Premium


Premium


Premium


Premium


Premium


Premium


Premium


Premium


Premium


Premium


Premium


Premium


Premium


Premium


Premium


Premium


Premium


Premium