
- Home >
- Stock Photos >
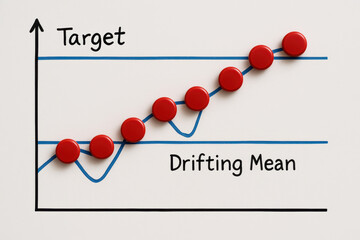
- Falling Statistics with Red Graph on Digital Interface
Falling Statistics with Red Graph on Digital Interface Image

Visual represents declining data trends overlaid with binary digits, highlighting global business challenges. Suitable for presentations on economic downturns, finance workshops, or data analysis themes.
Powered by 


downloads
Tags:
More
Credit Photo
If you would like to credit the Photo, here are some ways you can do so
Text Link
photo Link
<span class="text-link">
<span>
<a target="_blank" href=https://pikwizard.com/photo/falling-statistics-with-red-graph-on-digital-interface/edc0777509362a015eaea0af73d58d1b/>PikWizard</a>
</span>
</span>
<span class="image-link">
<span
style="margin: 0 0 20px 0; display: inline-block; vertical-align: middle; width: 100%;"
>
<a
target="_blank"
href="https://pikwizard.com/photo/falling-statistics-with-red-graph-on-digital-interface/edc0777509362a015eaea0af73d58d1b/"
style="text-decoration: none; font-size: 10px; margin: 0;"
>
<img src="https://pikwizard.com/pw/medium/edc0777509362a015eaea0af73d58d1b.jpg" style="margin: 0; width: 100%;" alt="" />
<p style="font-size: 12px; margin: 0;">PikWizard</p>
</a>
</span>
</span>
Free (free of charge)
Free for personal and commercial use.
Author: Creative Art
Similar Free Stock Images

Premium


Premium


Premium

Premium


Premium


Premium


Premium


Premium


Premium

Premium


Premium


Premium

Premium


Premium

Premium


Premium


Premium

Premium


Premium


Premium


Premium


Premium


Premium


Premium

Premium


Explore More Free Stock Images