- Home >
- Stock Photos >
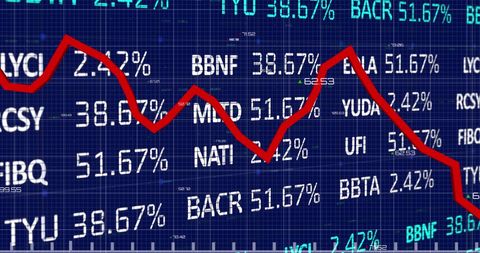
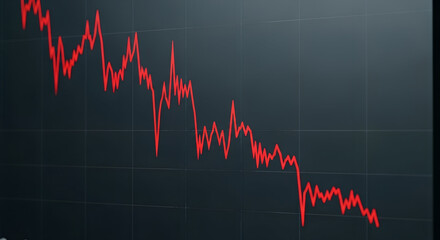
- Falling Stock Market Data with Red Line Indicator
Falling Stock Market Data with Red Line Indicator Image

Features a digital representation of stock market data with a prominent red line indicating a downward trend. Suitable for illustrating concepts related to economic downturns, financial analyses, or data-driven decision making.
Powered by 


2
downloads
downloads
Tags:
More
Credit Photo
If you would like to credit the Photo, here are some ways you can do so
Text Link
photo Link
<span class="text-link">
<span>
<a target="_blank" href=https://pikwizard.com/photo/falling-stock-market-data-with-red-line-indicator/d4b2985750c9094deba95ec4d843fe51/>PikWizard</a>
</span>
</span>
<span class="image-link">
<span
style="margin: 0 0 20px 0; display: inline-block; vertical-align: middle; width: 100%;"
>
<a
target="_blank"
href="https://pikwizard.com/photo/falling-stock-market-data-with-red-line-indicator/d4b2985750c9094deba95ec4d843fe51/"
style="text-decoration: none; font-size: 10px; margin: 0;"
>
<img src="https://pikwizard.com/pw/medium/d4b2985750c9094deba95ec4d843fe51.jpg" style="margin: 0; width: 100%;" alt="" />
<p style="font-size: 12px; margin: 0;">PikWizard</p>
</a>
</span>
</span>
Free (free of charge)
Free for personal and commercial use.
Author: People Creations
Similar Free Stock Images
Loading...


Premium


Premium


Premium


Premium


Premium


Premium


Premium


Premium


Premium

Premium


Premium


Premium

Premium


Premium


Premium


Premium


Premium

Premium


Premium


Premium


Premium

Premium

Premium

Premium


Premium