- Home >
- Stock Photos >
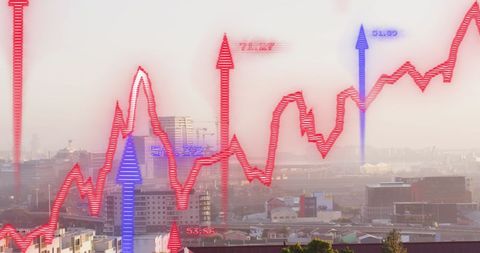
- Falling Stock Prices in Digital Data Display
Falling Stock Prices in Digital Data Display Image

Digital display shows fall in stock prices against abstract backdrop of a global financial map. Red zigzag lines symbolize declining profits or economic fragility, relevant for investors and reports highlighting market volatility. Useful for business presentations, reports on market trends, and educational materials illustrating data interpretation.

downloads
Tags:
More
Credit Photo
If you would like to credit the Photo, here are some ways you can do so
Text Link
photo Link
<span class="text-link">
<span>
<a target="_blank" href=https://pikwizard.com/photo/falling-stock-prices-in-digital-data-display/79c0321494f8fbdae0701da62eace25e/>PikWizard</a>
</span>
</span>
<span class="image-link">
<span
style="margin: 0 0 20px 0; display: inline-block; vertical-align: middle; width: 100%;"
>
<a
target="_blank"
href="https://pikwizard.com/photo/falling-stock-prices-in-digital-data-display/79c0321494f8fbdae0701da62eace25e/"
style="text-decoration: none; font-size: 10px; margin: 0;"
>
<img src="https://pikwizard.com/pw/medium/79c0321494f8fbdae0701da62eace25e.jpg" style="margin: 0; width: 100%;" alt="" />
<p style="font-size: 12px; margin: 0;">PikWizard</p>
</a>
</span>
</span>
Free (free of charge)
Free for personal and commercial use.
Author: Awesome Content