
- Home >
- Stock Photos >
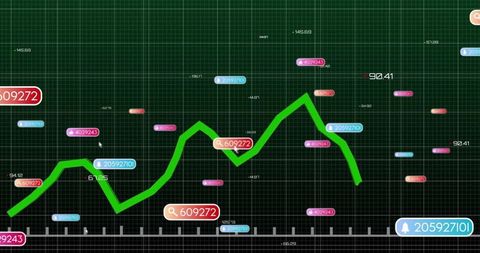
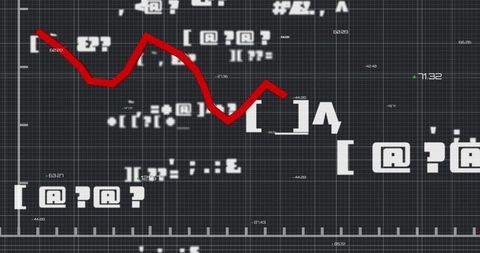
- Falling Trend Line on Data Dashboard Background with Interactive Elements
Falling Trend Line on Data Dashboard Background with Interactive Elements Image

This visual illustrates a dynamic data dashboard featuring a descending red line graph. Graphic elements like heart and share icons suggest interactive engagement metrics at specific data points. Ideal for projects focusing on data analytics, technological insights, or business trends discussions, significantly appealing to markets targeting innovation in digital analytics.
Powered by 


downloads
Tags:
More
Credit Photo
If you would like to credit the Photo, here are some ways you can do so
Text Link
photo Link
<span class="text-link">
<span>
<a target="_blank" href=https://pikwizard.com/photo/falling-trend-line-on-data-dashboard-background-with-interactive-elements/0c9a3c4ead5528785eac470e6b778de5/>PikWizard</a>
</span>
</span>
<span class="image-link">
<span
style="margin: 0 0 20px 0; display: inline-block; vertical-align: middle; width: 100%;"
>
<a
target="_blank"
href="https://pikwizard.com/photo/falling-trend-line-on-data-dashboard-background-with-interactive-elements/0c9a3c4ead5528785eac470e6b778de5/"
style="text-decoration: none; font-size: 10px; margin: 0;"
>
<img src="https://pikwizard.com/pw/medium/0c9a3c4ead5528785eac470e6b778de5.jpg" style="margin: 0; width: 100%;" alt="" />
<p style="font-size: 12px; margin: 0;">PikWizard</p>
</a>
</span>
</span>
Free (free of charge)
Free for personal and commercial use.
Author: Creative Art
Similar Free Stock Images

Premium


Premium

Premium


Premium


Premium


Premium


Premium


Premium


Premium


Premium


Premium

Premium


Premium


Explore More Free Stock Images