
- Home >
- Stock Photos >
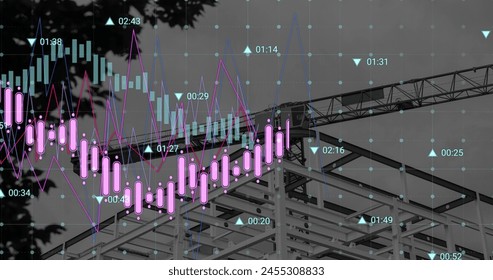
- Finance and Architecture Intersection with Data Analytics Overlay
Finance and Architecture Intersection with Data Analytics Overlay Image

This image depicts a strong blend of financial data and architectural concepts, signifying the application of data analytics within the field of architecture. The overlay of stock prices and graphs symbolizes the modern intersection of finance and architectural planning, making it ideal for use in presentations or articles focused on smart building investments or tech-driven architectural innovations. It can also be utilized in marketing materials targeting businesses that harness data for infrastructural projects.
Powered by  - Get 15% off with code: PIKWIZARD15


downloads
Tags:
More
Credit Photo
If you would like to credit the Photo, here are some ways you can do so
Text Link
photo Link
<span class="text-link">
<span>
<a target="_blank" href=https://pikwizard.com/photo/finance-and-architecture-intersection-with-data-analytics-overlay/150a1e53302f85484c8c284dba91fb98/>PikWizard</a>
</span>
</span>
<span class="image-link">
<span
style="margin: 0 0 20px 0; display: inline-block; vertical-align: middle; width: 100%;"
>
<a
target="_blank"
href="https://pikwizard.com/photo/finance-and-architecture-intersection-with-data-analytics-overlay/150a1e53302f85484c8c284dba91fb98/"
style="text-decoration: none; font-size: 10px; margin: 0;"
>
<img src="https://pikwizard.com/pw/medium/150a1e53302f85484c8c284dba91fb98.jpg" style="margin: 0; width: 100%;" alt="" />
<p style="font-size: 12px; margin: 0;">PikWizard</p>
</a>
</span>
</span>
Free (free of charge)
Free for personal and commercial use.
Author: Authentic Images
Similar Free Stock Images

Premium


Premium

Premium


Premium


Premium

Premium


Premium


Premium


Premium

Premium

Premium

Premium


Premium


Premium


Premium


Premium


Premium


Premium


Premium


Premium


Premium

Premium


Premium


Premium


Premium


Explore More Free Stock Images