
- Home >
- Stock Photos >
- Finance and Tech: Dynamic Urban Data Visualization Overlay
Finance and Tech: Dynamic Urban Data Visualization Overlay Image
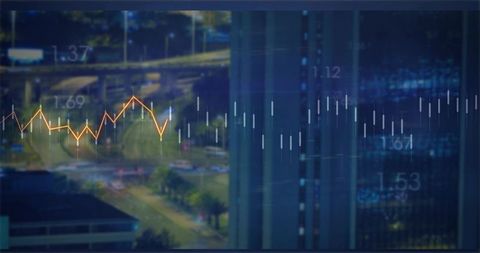
This image depicts a dynamic blend of orange line graph and white candlesticks overlaying an urban intersection and office tower backdrop, representing the convergence of financial technology with modern city living. Ideal for use in presentations, articles, or websites focused on investment strategies, smart city innovation, or the impact of technology on urban life. It visually conveys the integration of analytical data with modern urban environments, enhancing narratives on economic trends and technological advancements in business districts.
Powered by  - Get 15% off with code: PIKWIZARD15


downloads
Tags:
More
Credit Photo
If you would like to credit the Photo, here are some ways you can do so
Text Link
photo Link
<span class="text-link">
<span>
<a target="_blank" href=https://pikwizard.com/photo/finance-and-tech-dynamic-urban-data-visualization-overlay/1786348d639a1abe0eeb7bb04dd01d04/>PikWizard</a>
</span>
</span>
<span class="image-link">
<span
style="margin: 0 0 20px 0; display: inline-block; vertical-align: middle; width: 100%;"
>
<a
target="_blank"
href="https://pikwizard.com/photo/finance-and-tech-dynamic-urban-data-visualization-overlay/1786348d639a1abe0eeb7bb04dd01d04/"
style="text-decoration: none; font-size: 10px; margin: 0;"
>
<img src="https://pikwizard.com/pw/medium/1786348d639a1abe0eeb7bb04dd01d04.jpg" style="margin: 0; width: 100%;" alt="" />
<p style="font-size: 12px; margin: 0;">PikWizard</p>
</a>
</span>
</span>
Free (free of charge)
Free for personal and commercial use.
Author: Authentic Images