
- Home >
- Stock Photos >
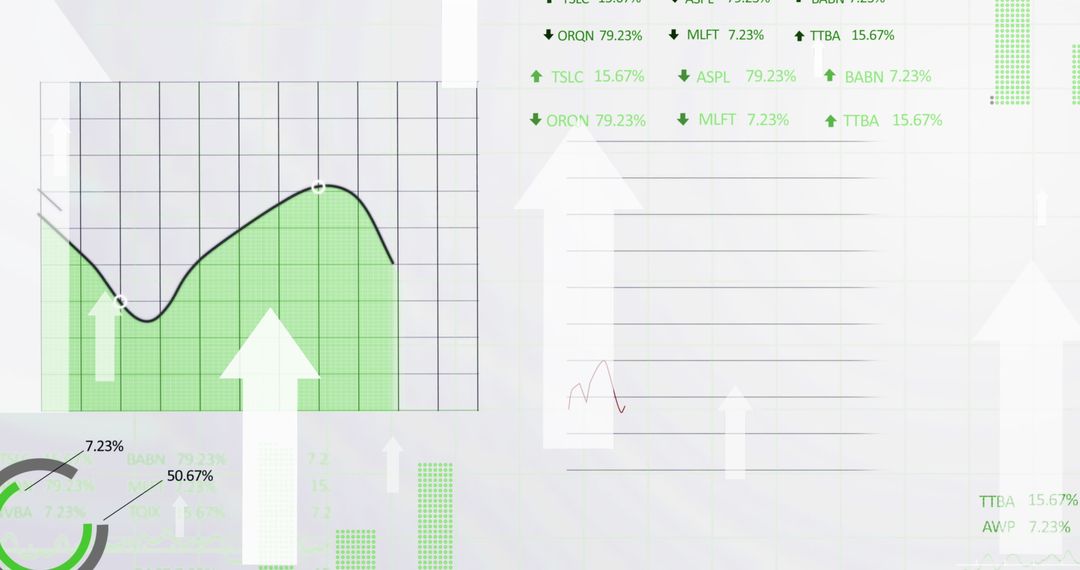
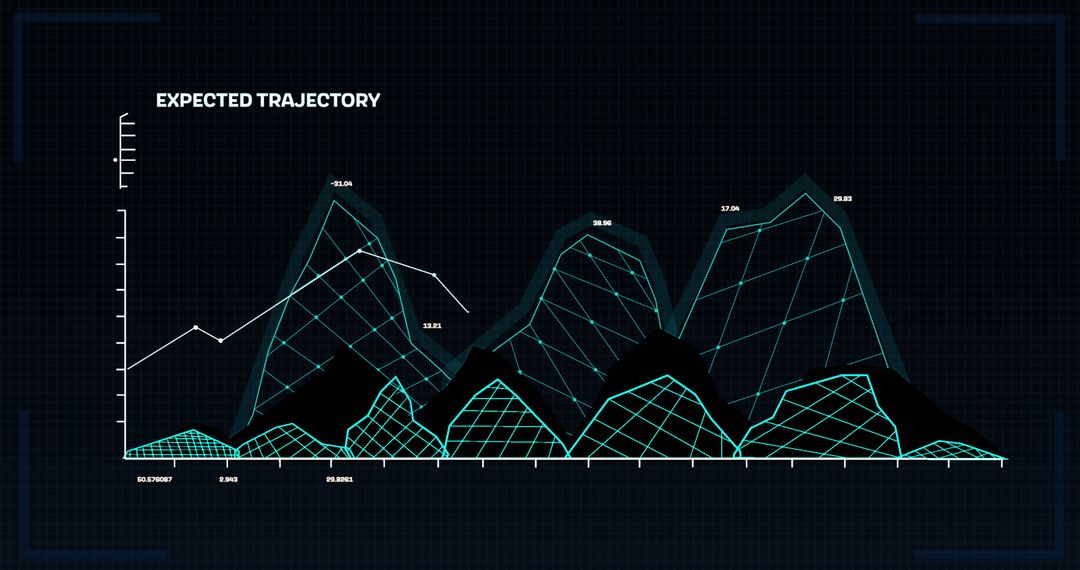
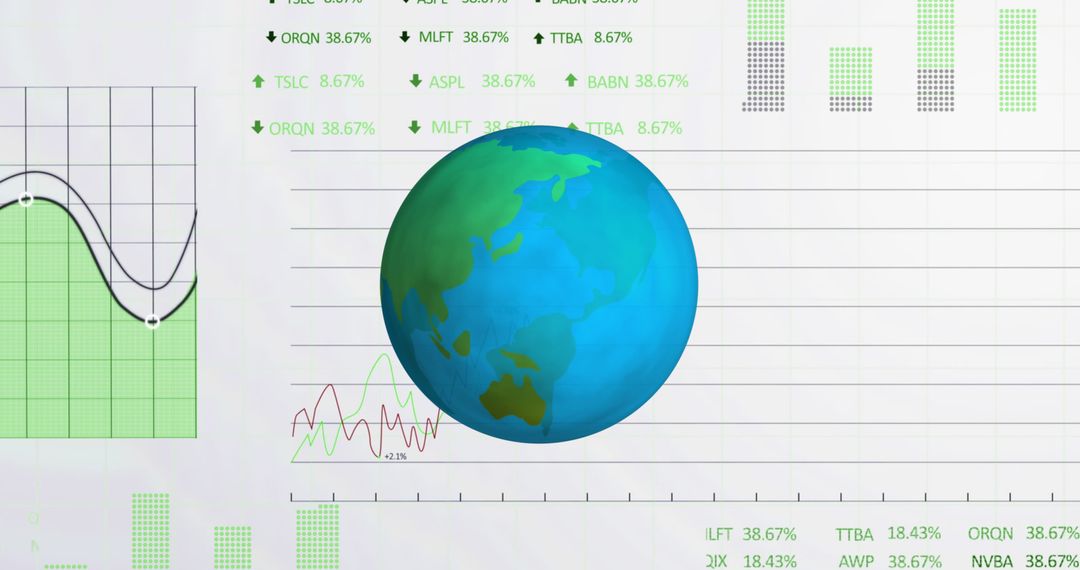
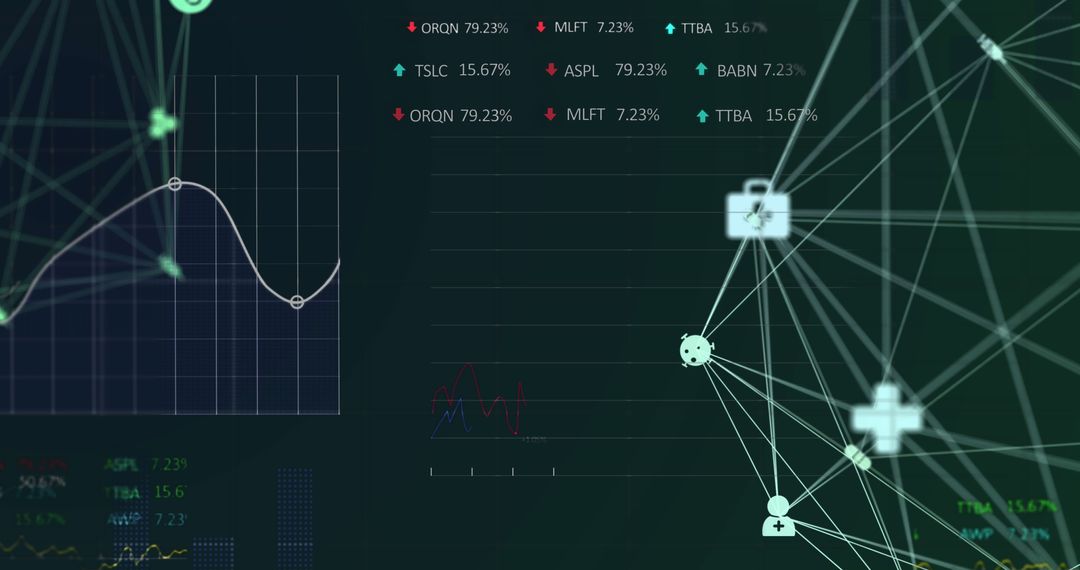
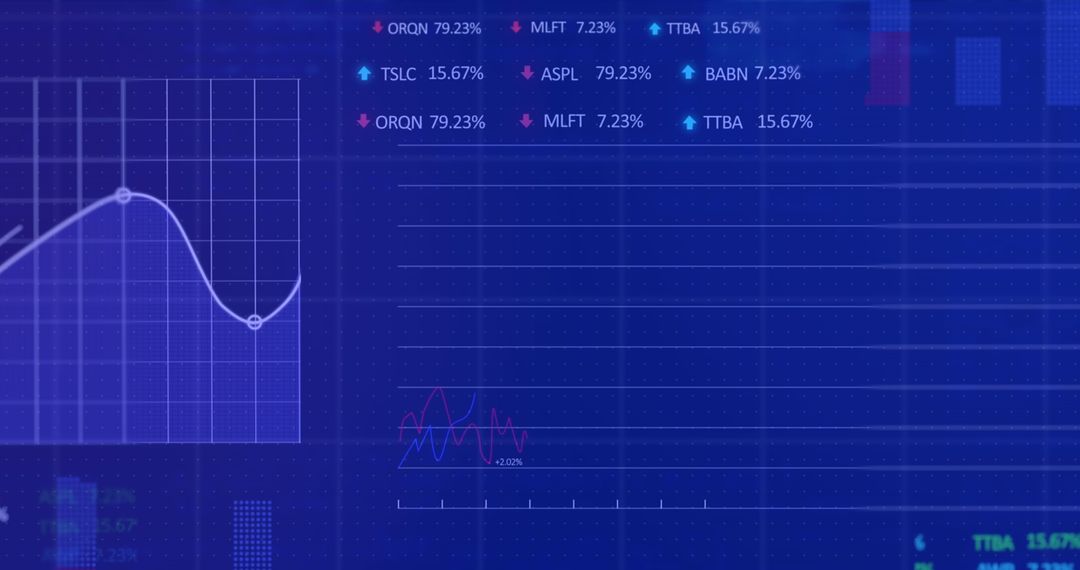
- Finance and Technology Concept with Holographic Graphs
Finance and Technology Concept with Holographic Graphs Image

This design combines elements of finance and technology, utilizing holographic visuals of graphs and trading boards. Useful for illustrating concepts related to cloud computing, digital stock trading, and dynamic data analysis. Ideal for presentations on business intelligence, financial market trends, and cutting-edge technological advancements.
Powered by  - Get 15% off with code: PIKWIZARD15


2
downloads
downloads
Tags:
More
Credit Photo
If you would like to credit the Photo, here are some ways you can do so
Text Link
photo Link
<span class="text-link">
<span>
<a target="_blank" href=https://pikwizard.com/photo/finance-and-technology-concept-with-holographic-graphs/bb1ef2ec5cb5e9239abb5898a94c7470/>PikWizard</a>
</span>
</span>
<span class="image-link">
<span
style="margin: 0 0 20px 0; display: inline-block; vertical-align: middle; width: 100%;"
>
<a
target="_blank"
href="https://pikwizard.com/photo/finance-and-technology-concept-with-holographic-graphs/bb1ef2ec5cb5e9239abb5898a94c7470/"
style="text-decoration: none; font-size: 10px; margin: 0;"
>
<img src="https://pikwizard.com/pw/medium/bb1ef2ec5cb5e9239abb5898a94c7470.jpg" style="margin: 0; width: 100%;" alt="" />
<p style="font-size: 12px; margin: 0;">PikWizard</p>
</a>
</span>
</span>
Free (free of charge)
Free for personal and commercial use.
Author: Creative Art
Similar Free Stock Images

Premium


Premium


Premium


Premium


Premium


Premium


Premium


Premium


Premium


Premium


Premium


Premium


Premium


Premium


Premium


Premium


Premium


Premium


Premium


Premium


Premium


Premium


Premium


Premium

