
- Home >
- Stock Photos >
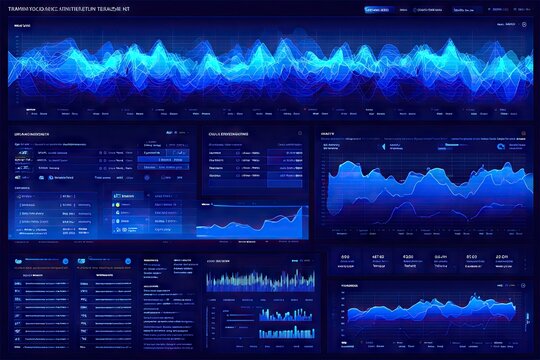
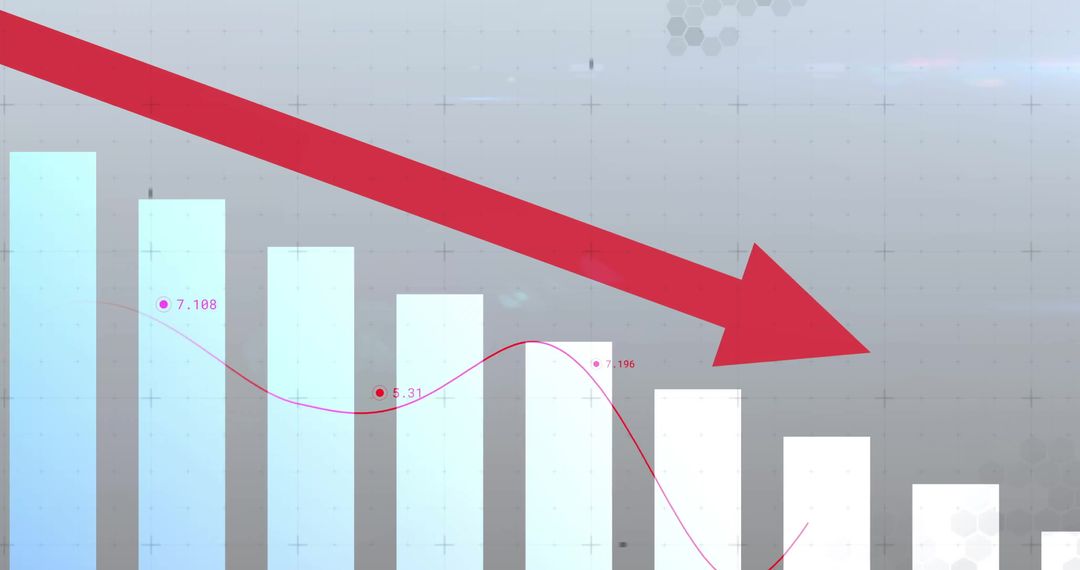
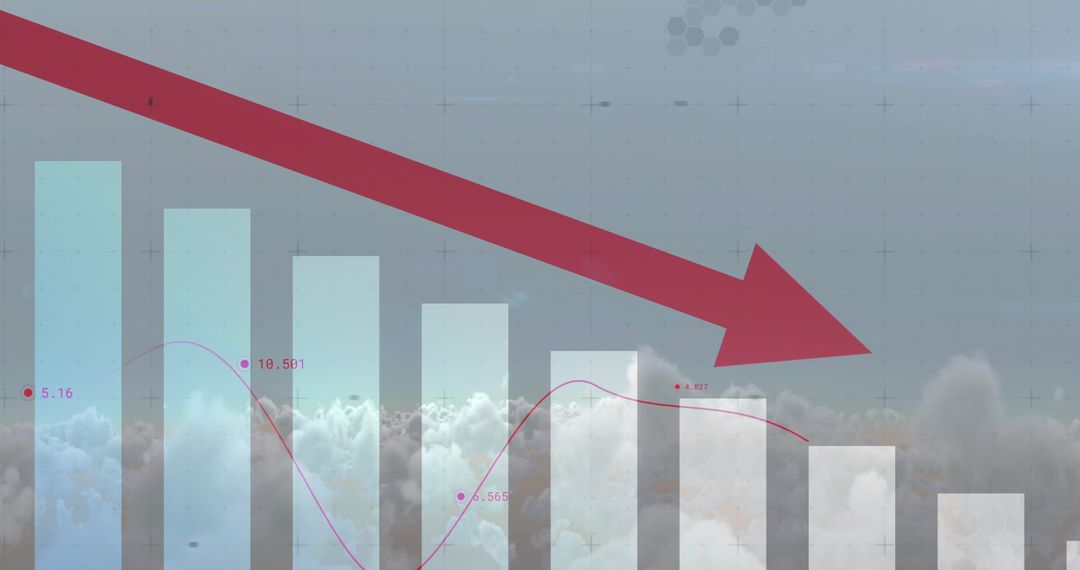
- Finance Dashboard with Declining Market Trend Indicators
Finance Dashboard with Declining Market Trend Indicators Image

Illustrates declining market trends with bar chart and line graph overlayed by noticeable red arrow pointing downwards. Suitable for articles, presentations, or reports on investment, market predictions, financial crises, economic downturns, or data analytics. Visual aids in conveying financial decreases effectively.
Powered by 


0
downloads
downloads
Tags:
More
Credit Photo
If you would like to credit the Photo, here are some ways you can do so
Text Link
photo Link
<span class="text-link">
<span>
<a target="_blank" href=https://pikwizard.com/photo/finance-dashboard-with-declining-market-trend-indicators/6fbfef06bf0d24f3fb614622d7a1ae88/>PikWizard</a>
</span>
</span>
<span class="image-link">
<span
style="margin: 0 0 20px 0; display: inline-block; vertical-align: middle; width: 100%;"
>
<a
target="_blank"
href="https://pikwizard.com/photo/finance-dashboard-with-declining-market-trend-indicators/6fbfef06bf0d24f3fb614622d7a1ae88/"
style="text-decoration: none; font-size: 10px; margin: 0;"
>
<img src="https://pikwizard.com/pw/medium/6fbfef06bf0d24f3fb614622d7a1ae88.jpg" style="margin: 0; width: 100%;" alt="" />
<p style="font-size: 12px; margin: 0;">PikWizard</p>
</a>
</span>
</span>
Free (free of charge)
Free for personal and commercial use.
Author: Authentic Images
Similar Free Stock Images

Premium


Premium


Premium


Premium


Premium


Premium


Premium


Premium


Premium


Premium


Premium


Premium


Premium


Premium


Premium


Premium


Premium


Premium


Premium


Premium


Premium


Premium


Premium


Premium

