- Home >
- Stock Photos >
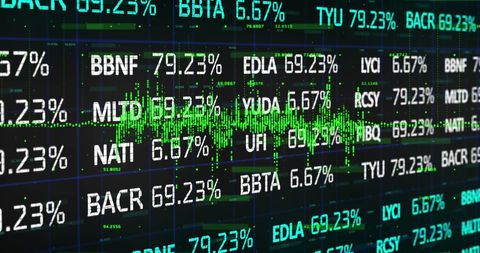
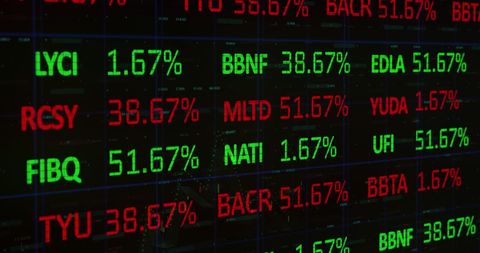
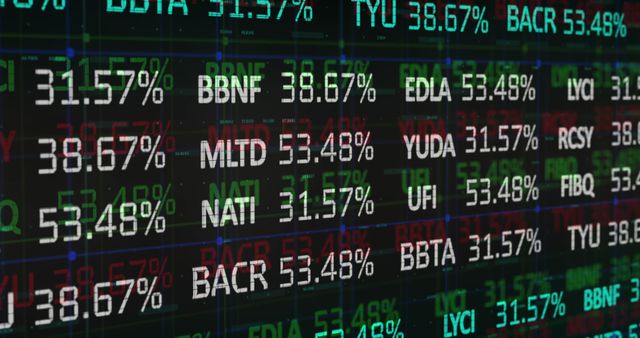
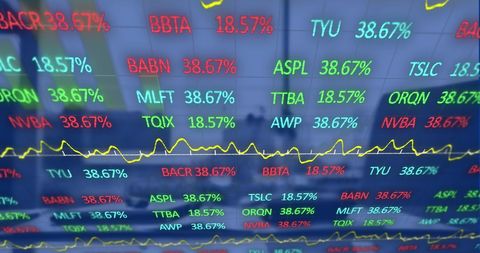
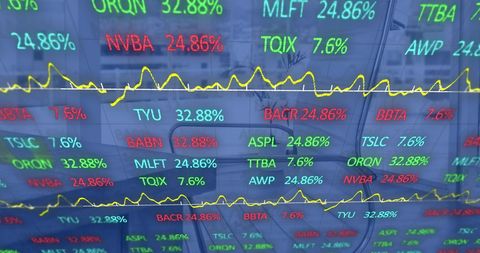
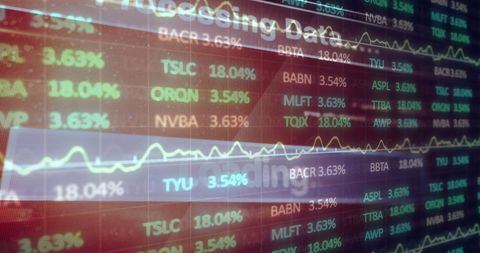
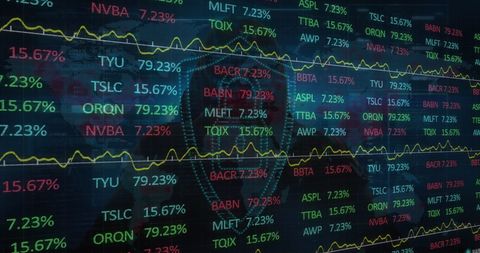
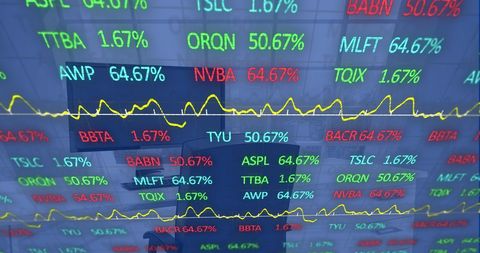
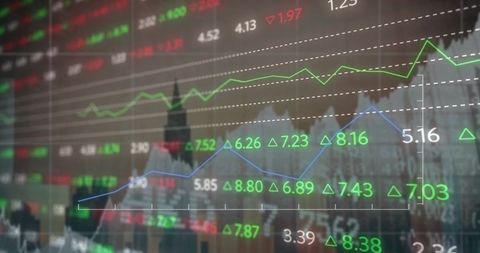
- Finance Data Charts with Multiple Percent Indicators
Finance Data Charts with Multiple Percent Indicators Image
This image shows detailed global finance data, making it ideal for illustrating stock market trends and business reports. It is also useful for educational content on economics and investment strategy presentations.

downloads
Tags:
More
Credit Photo
If you would like to credit the Photo, here are some ways you can do so
Text Link
photo Link
<span class="text-link">
<span>
<a target="_blank" href=https://pikwizard.com/photo/finance-data-charts-with-multiple-percent-indicators/6c914a626e668985e3da42c7e4c19916/>PikWizard</a>
</span>
</span>
<span class="image-link">
<span
style="margin: 0 0 20px 0; display: inline-block; vertical-align: middle; width: 100%;"
>
<a
target="_blank"
href="https://pikwizard.com/photo/finance-data-charts-with-multiple-percent-indicators/6c914a626e668985e3da42c7e4c19916/"
style="text-decoration: none; font-size: 10px; margin: 0;"
>
<img src="https://pikwizard.com/pw/medium/6c914a626e668985e3da42c7e4c19916.jpg" style="margin: 0; width: 100%;" alt="" />
<p style="font-size: 12px; margin: 0;">PikWizard</p>
</a>
</span>
</span>
Free (free of charge)
Free for personal and commercial use.
Author: Awesome Content