- Home >
- Stock Photos >
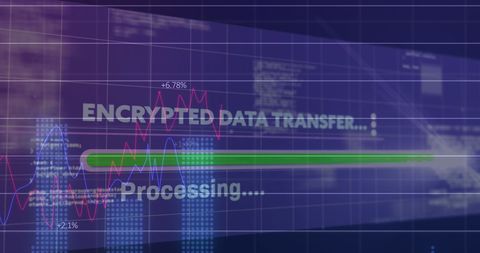
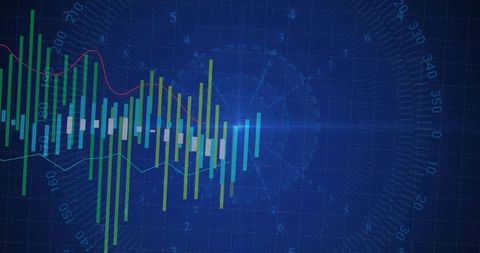
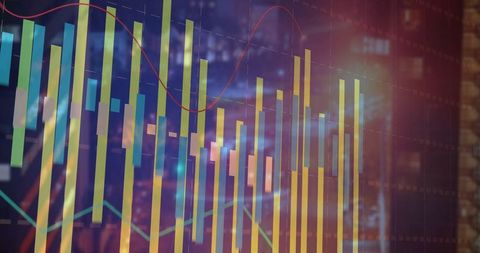
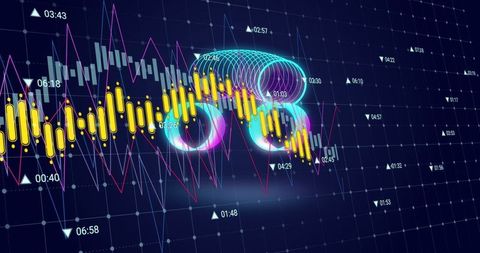
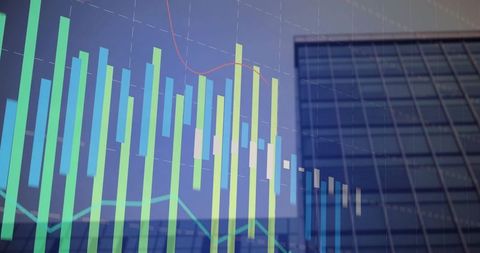
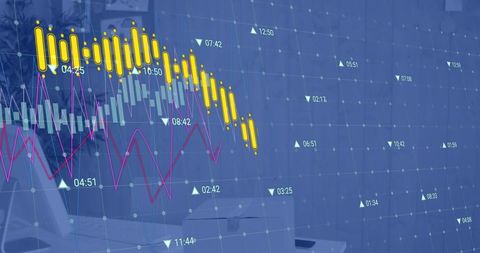
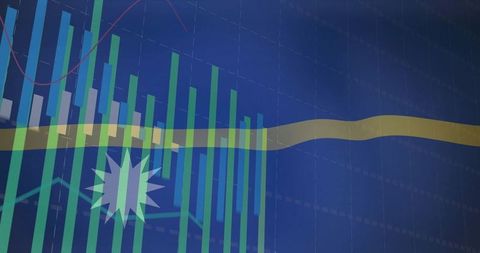
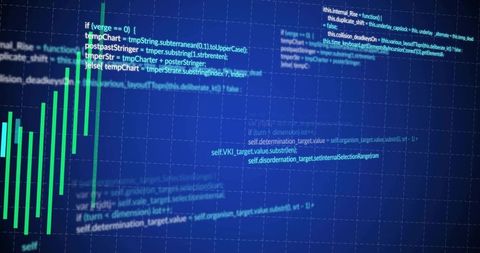
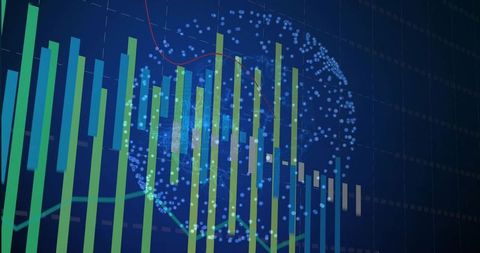
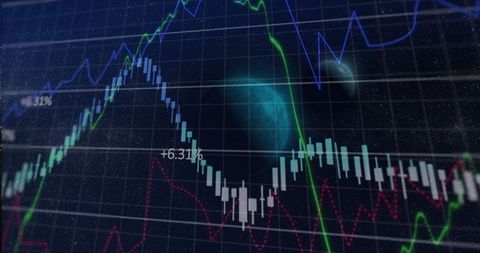
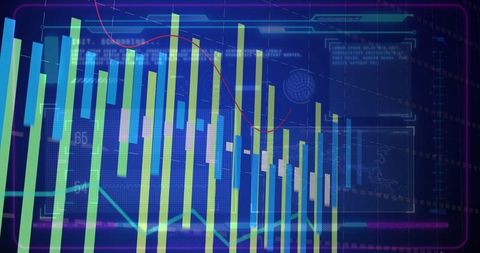
- Finance Data Visualization on Digital Dashboard with Candlestick Bars
Finance Data Visualization on Digital Dashboard with Candlestick Bars Image

Digital finance dashboard displays candlestick and bar charts on navy background. Suitable for usage in finance presentations, stock trend analysis, and technology-oriented blogs and content emphasizing data visualization and market analytics. Ideal for highlighting data-driven investment strategies and trends in stock markets.

downloads
Tags:
More
Credit Photo
If you would like to credit the Photo, here are some ways you can do so
Text Link
photo Link
<span class="text-link">
<span>
<a target="_blank" href=https://pikwizard.com/photo/finance-data-visualization-on-digital-dashboard-with-candlestick-bars/094a78e3c7b31939708a091af52f1e4d/>PikWizard</a>
</span>
</span>
<span class="image-link">
<span
style="margin: 0 0 20px 0; display: inline-block; vertical-align: middle; width: 100%;"
>
<a
target="_blank"
href="https://pikwizard.com/photo/finance-data-visualization-on-digital-dashboard-with-candlestick-bars/094a78e3c7b31939708a091af52f1e4d/"
style="text-decoration: none; font-size: 10px; margin: 0;"
>
<img src="https://pikwizard.com/pw/medium/094a78e3c7b31939708a091af52f1e4d.jpg" style="margin: 0; width: 100%;" alt="" />
<p style="font-size: 12px; margin: 0;">PikWizard</p>
</a>
</span>
</span>
Free (free of charge)
Free for personal and commercial use.
Author: Awesome Content