
- Home >
- Stock Photos >
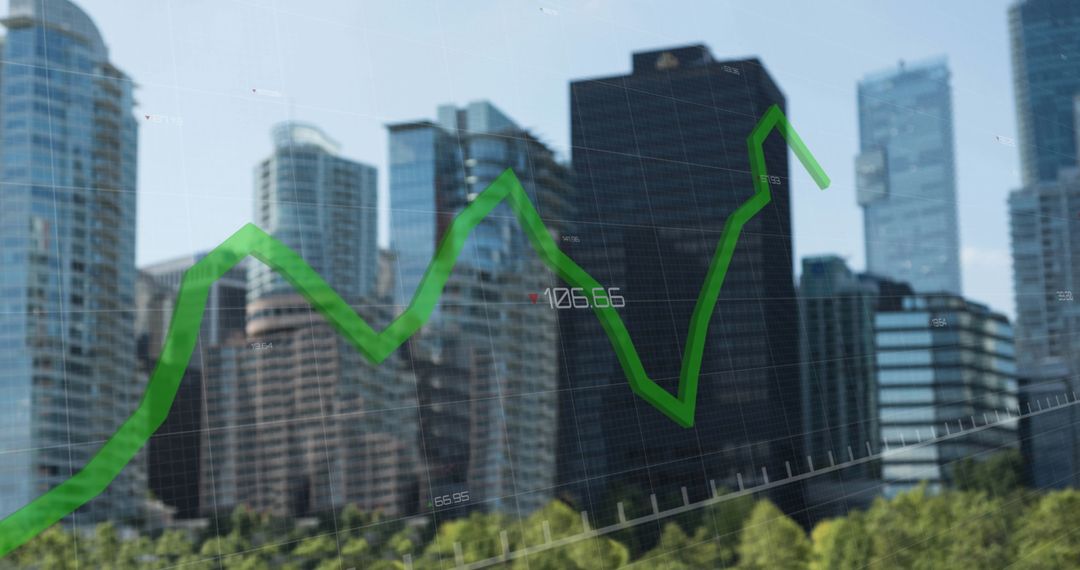
- Finance Green Line Graph Overlapping Urban Building
Finance Green Line Graph Overlapping Urban Building Image
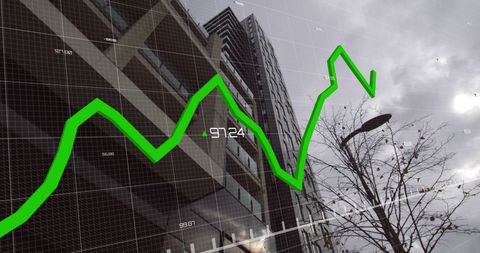
Dynamic display of financial data over urban backdrop, emphasizing economic trends and housing market insights, ideally suited for digital marketing, finance reports, and urban planning presentations.
Powered by  - Get 15% off with code: PIKWIZARD15


2
downloads
downloads
Tags:
More
Credit Photo
If you would like to credit the Photo, here are some ways you can do so
Text Link
photo Link
<span class="text-link">
<span>
<a target="_blank" href=https://pikwizard.com/photo/finance-green-line-graph-overlapping-urban-building/c22e8e78fbf7e3b7d6b6e0b62f7e5244/>PikWizard</a>
</span>
</span>
<span class="image-link">
<span
style="margin: 0 0 20px 0; display: inline-block; vertical-align: middle; width: 100%;"
>
<a
target="_blank"
href="https://pikwizard.com/photo/finance-green-line-graph-overlapping-urban-building/c22e8e78fbf7e3b7d6b6e0b62f7e5244/"
style="text-decoration: none; font-size: 10px; margin: 0;"
>
<img src="https://pikwizard.com/pw/medium/c22e8e78fbf7e3b7d6b6e0b62f7e5244.jpg" style="margin: 0; width: 100%;" alt="" />
<p style="font-size: 12px; margin: 0;">PikWizard</p>
</a>
</span>
</span>
Free (free of charge)
Free for personal and commercial use.
Author: Authentic Images
Similar Free Stock Images

Premium


Premium


Premium


Premium


Premium


Premium


Premium


Premium


Premium


Premium


Premium


Premium


Premium


Premium


Premium


Premium


Premium


Premium


Premium


Premium


Premium


Premium


Premium


Premium

