
- Home >
- Stock Photos >
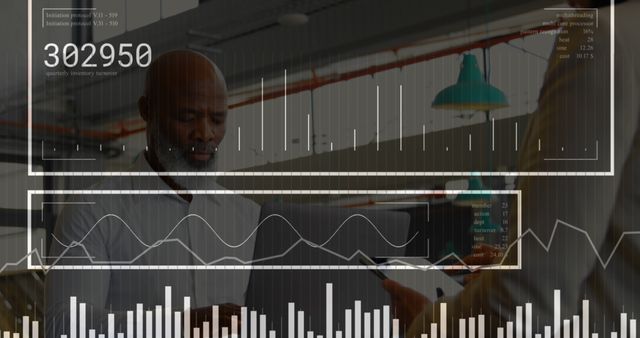
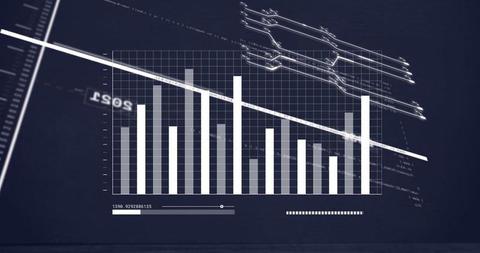
- Financial Analysis and Market Data Concept on Wooden Desk
Financial Analysis and Market Data Concept on Wooden Desk Image
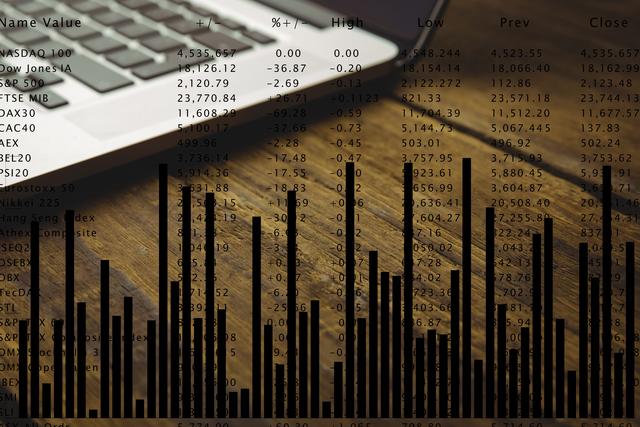
Visual showcases the intersection of finance and technology with a stock market graph overlay added to an image of a laptop. Ideal for illustrating financial reports, investment trend articles, or blog posts about data analysis. Can be used for business presentations, corporate settings, or fintech services.
Powered by 


downloads
Tags:
More
Credit Photo
If you would like to credit the Photo, here are some ways you can do so
Text Link
photo Link
<span class="text-link">
<span>
<a target="_blank" href=https://pikwizard.com/photo/financial-analysis-and-market-data-concept-on-wooden-desk/a5335e74326d24fa2f4fc4832704ec16/>PikWizard</a>
</span>
</span>
<span class="image-link">
<span
style="margin: 0 0 20px 0; display: inline-block; vertical-align: middle; width: 100%;"
>
<a
target="_blank"
href="https://pikwizard.com/photo/financial-analysis-and-market-data-concept-on-wooden-desk/a5335e74326d24fa2f4fc4832704ec16/"
style="text-decoration: none; font-size: 10px; margin: 0;"
>
<img src="https://pikwizard.com/pw/medium/a5335e74326d24fa2f4fc4832704ec16.jpg" style="margin: 0; width: 100%;" alt="" />
<p style="font-size: 12px; margin: 0;">PikWizard</p>
</a>
</span>
</span>
Free (free of charge)
Free for personal and commercial use.
Author: Creative Art
Similar Free Stock Images
Loading...


Premium


Premium


Premium


Premium


Premium


Premium


Premium


Premium


Premium


Premium

Premium

Premium


Premium


Premium


Premium


Premium


Premium

Premium


Premium


Premium

Premium


Premium


Premium


Premium

Premium


Explore More Free Stock Images