- Home >
- Stock Photos >
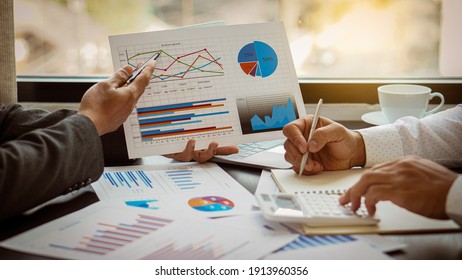
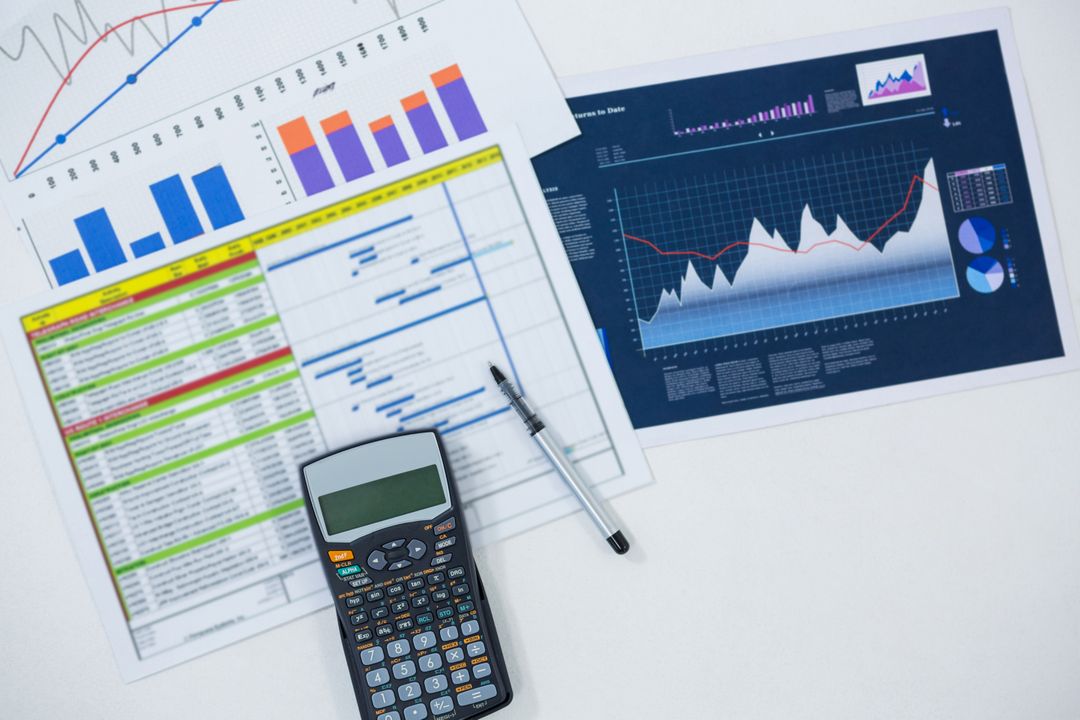
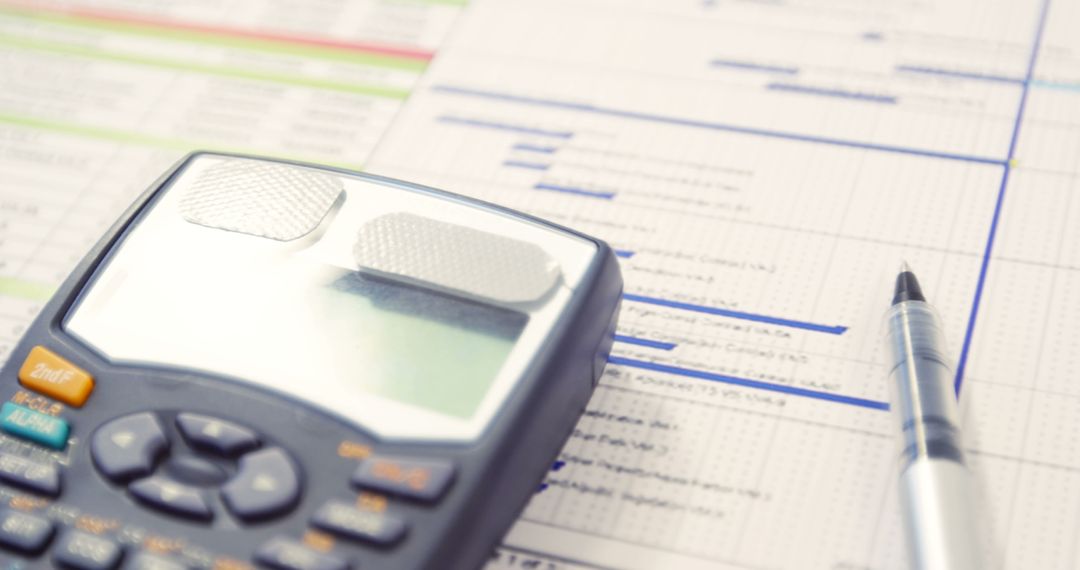
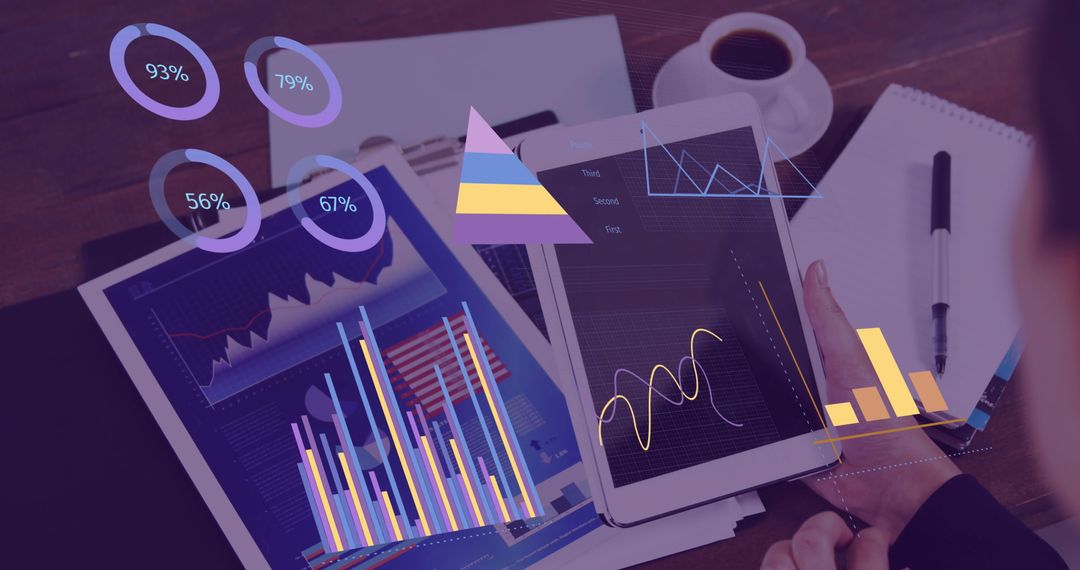
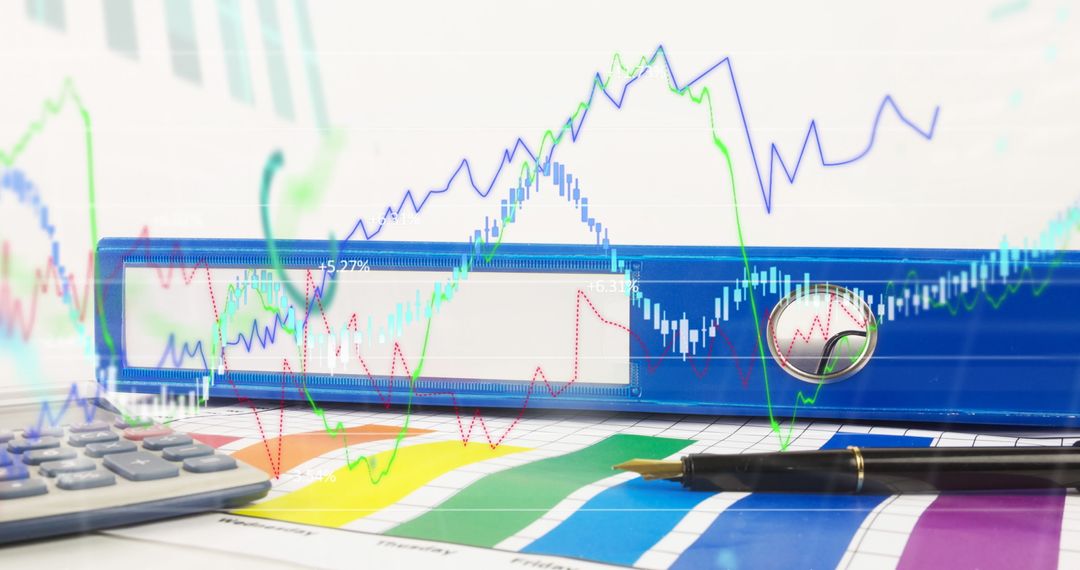
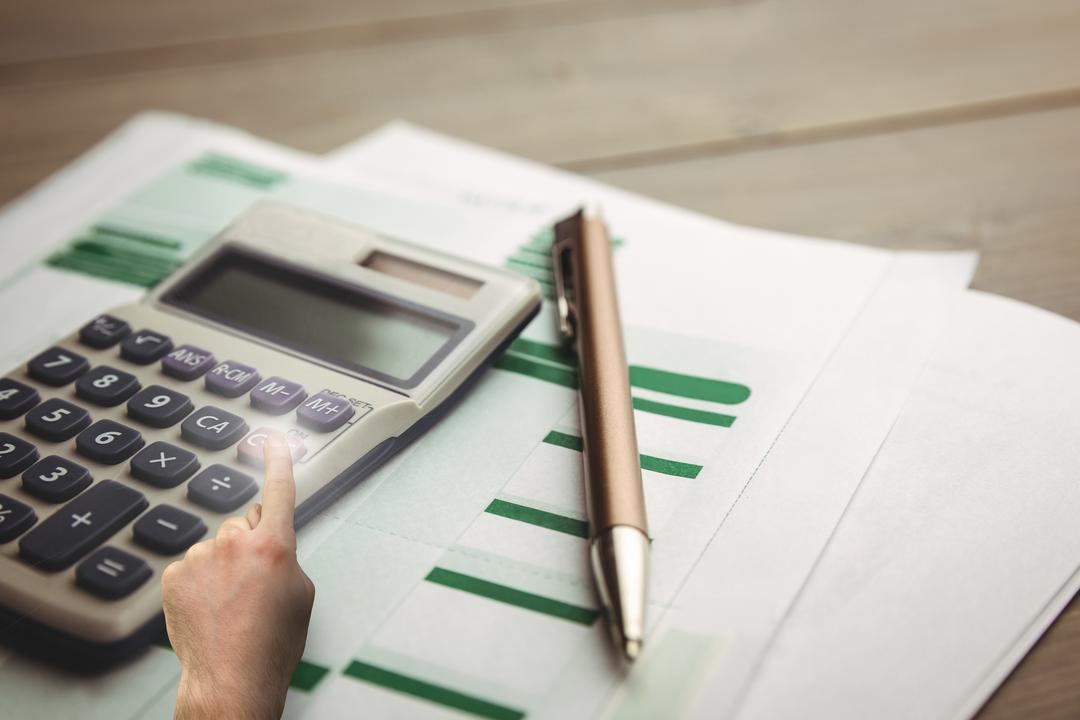
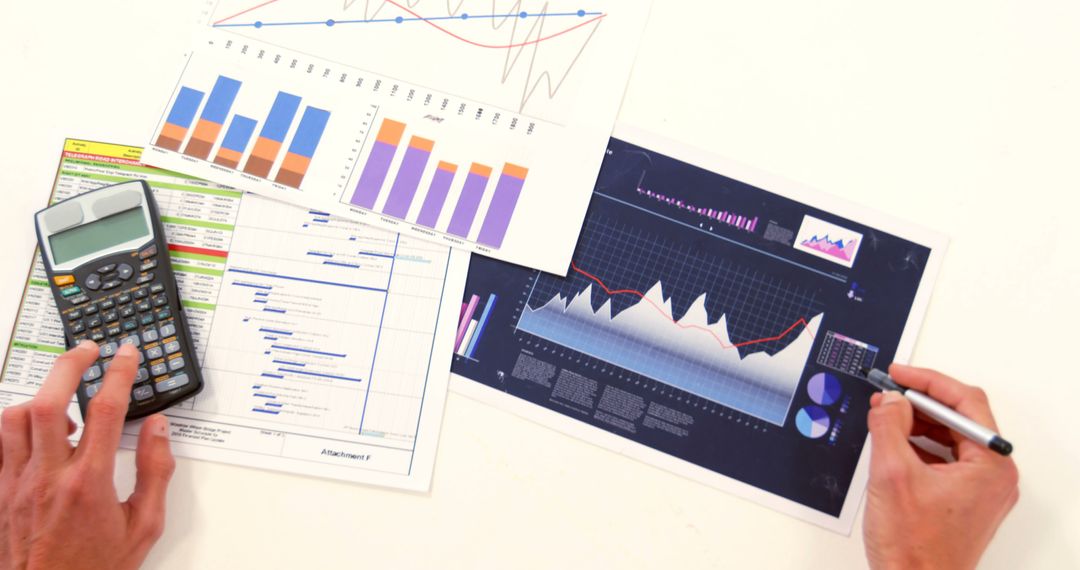
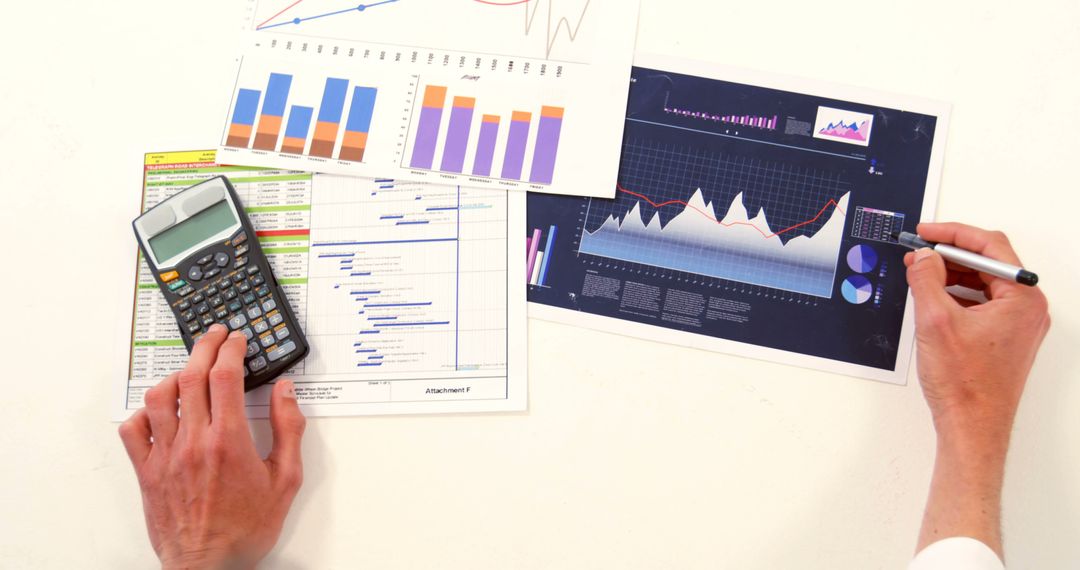
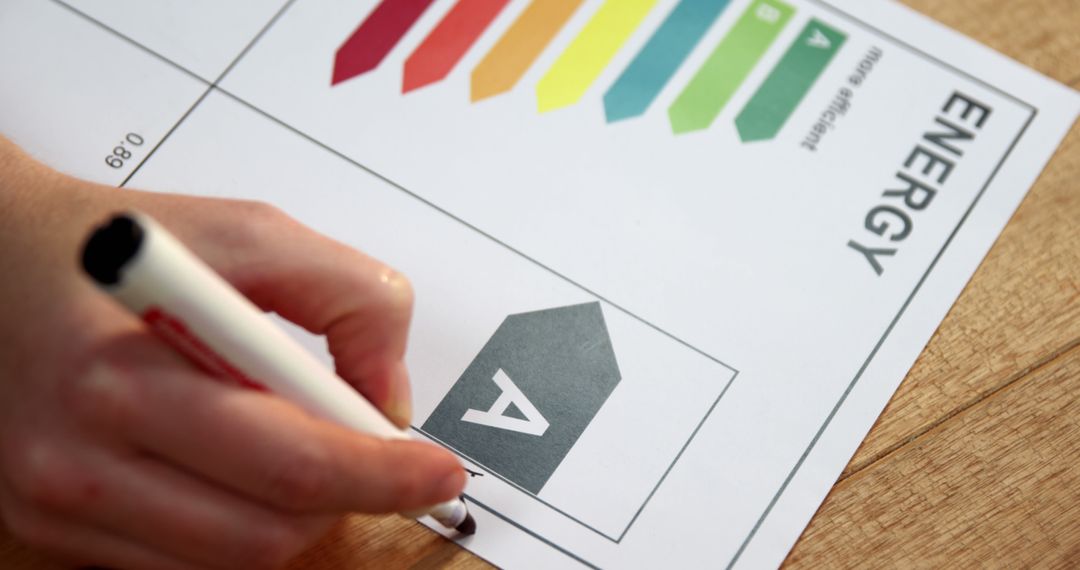
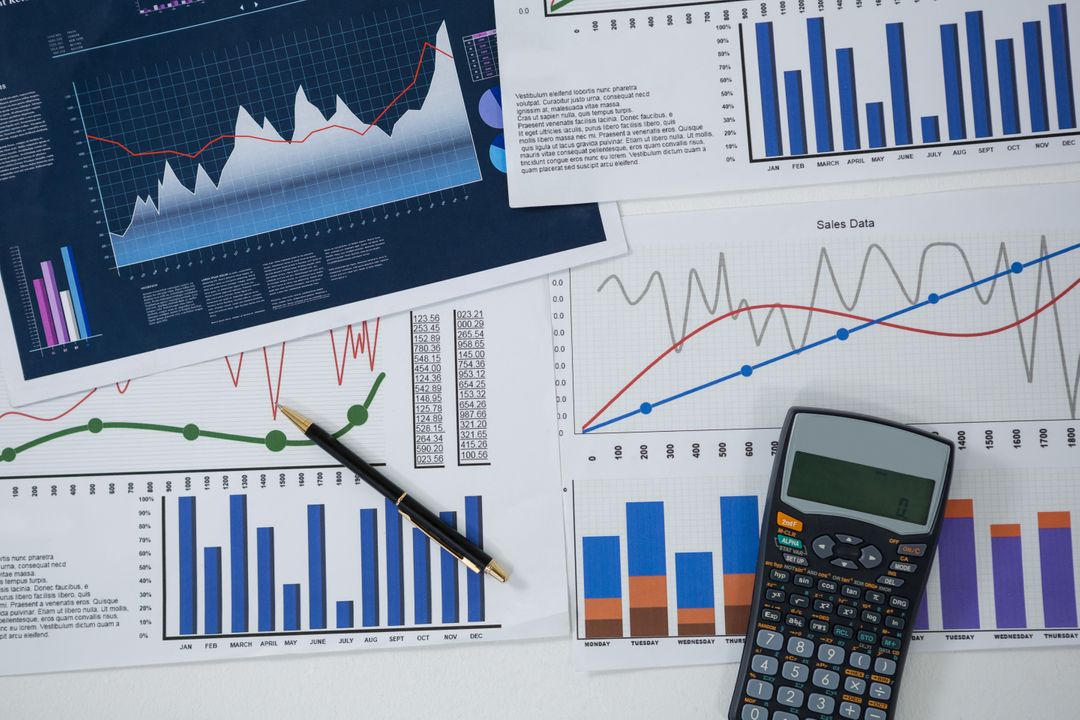
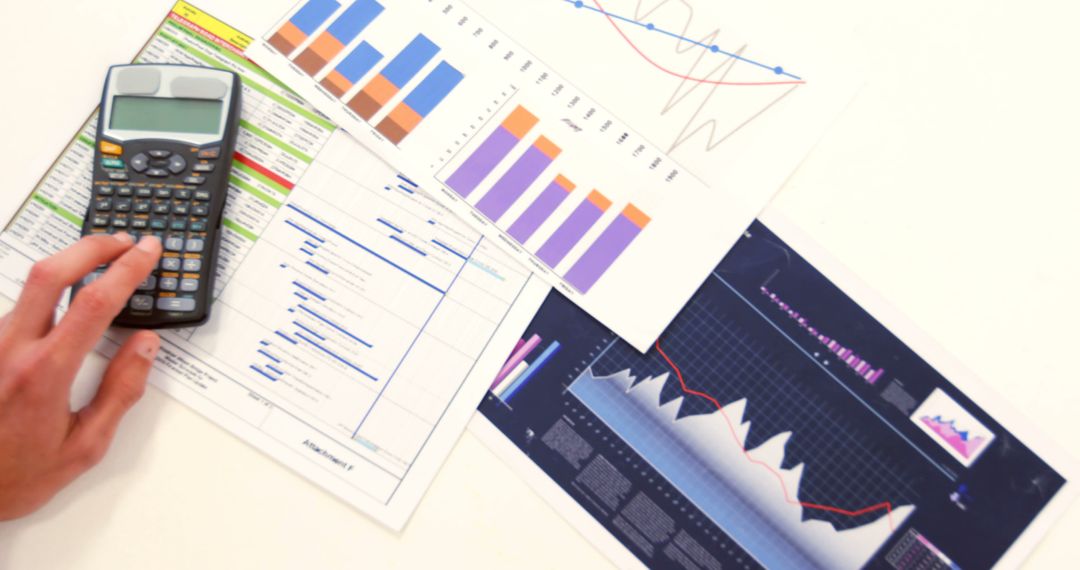
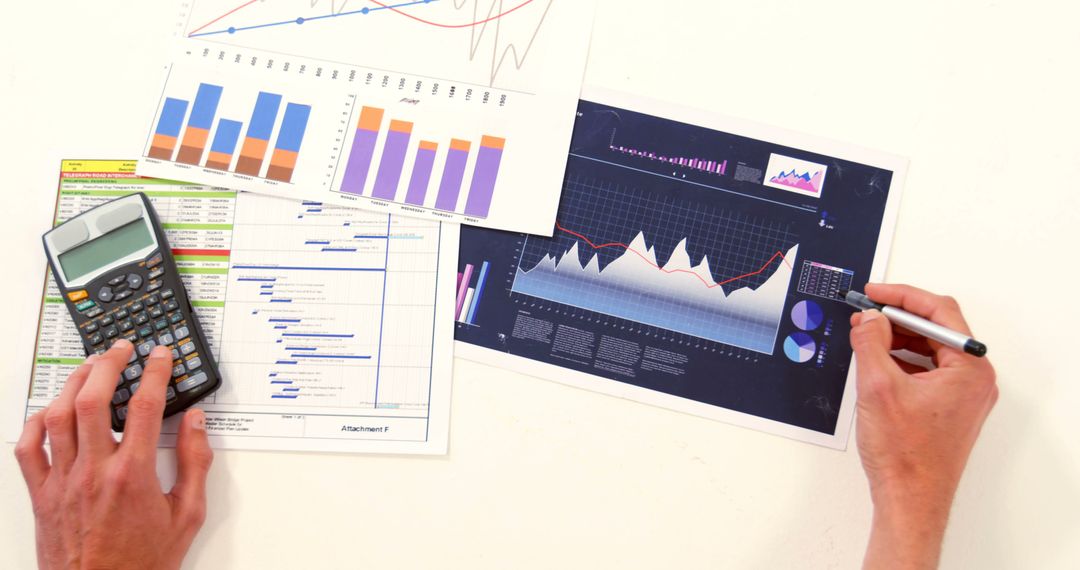
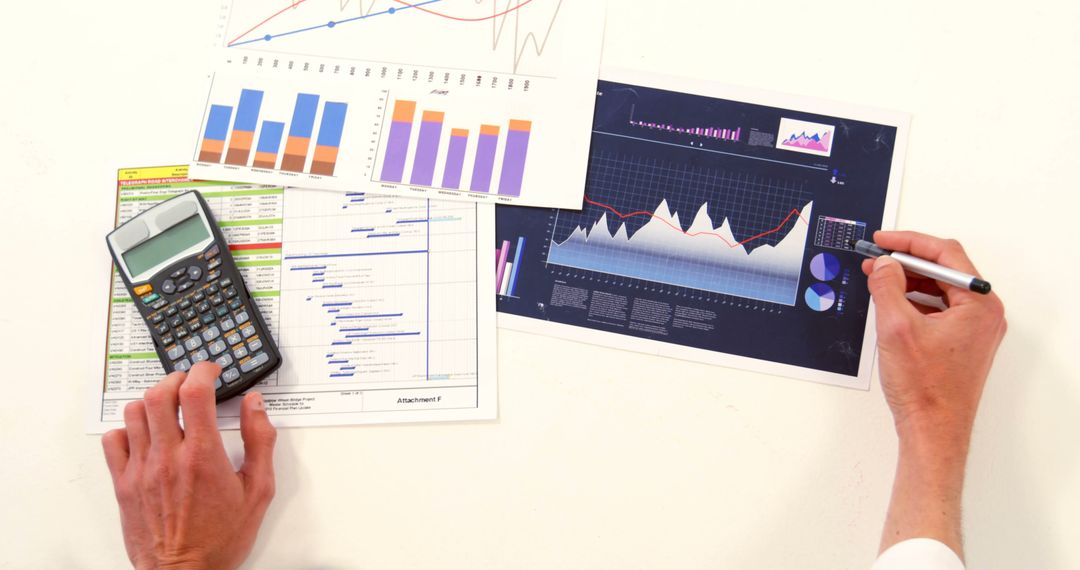
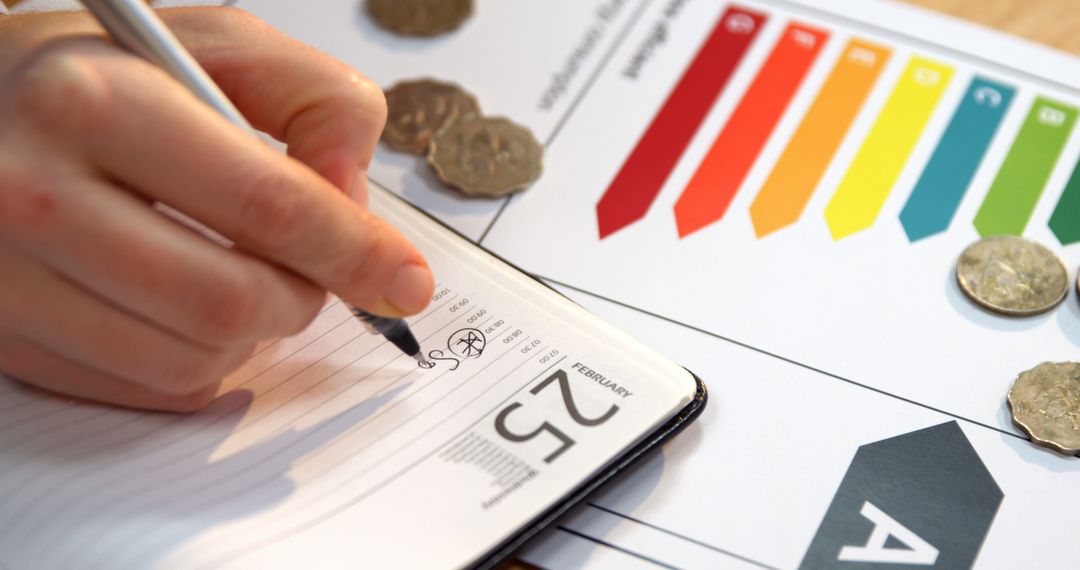
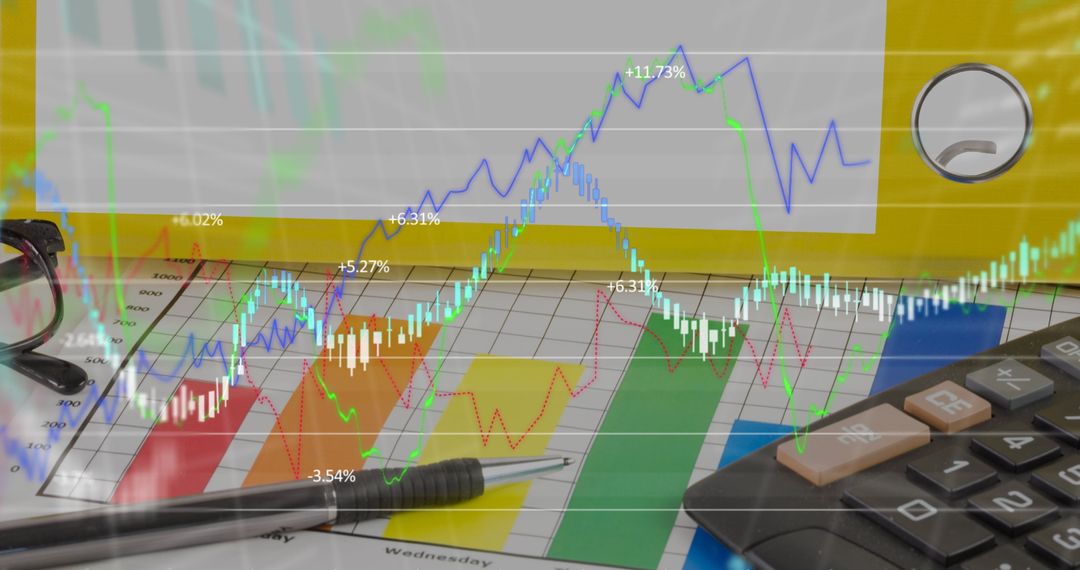
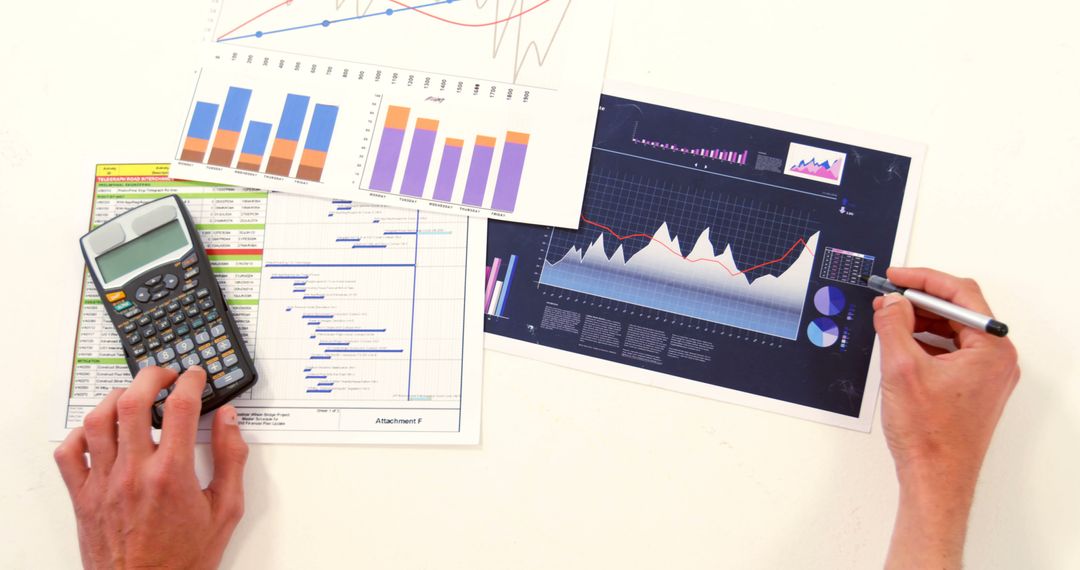
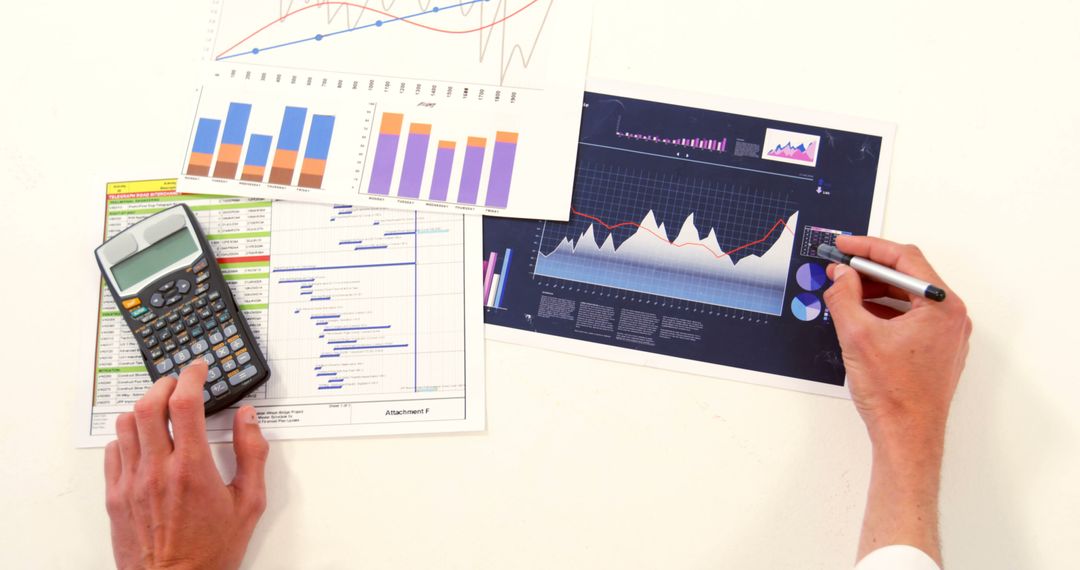
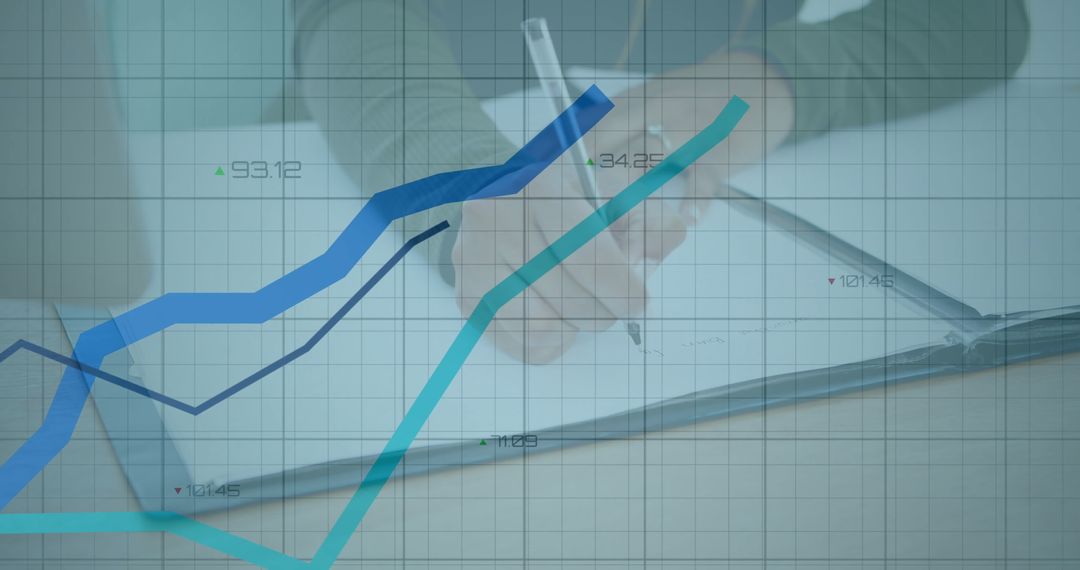
- Financial Analysis: Chart with Graph, Document, and Calculator on Desk
Financial Analysis: Chart with Graph, Document, and Calculator on Desk Image
Image depicts a financial analysis setting involving graph charts, a document with data rows, and a calculator. This can be used in articles about business finance management, economic reporting, statistical analysis, financial planning, and office workplace themes.
Powered by  - Get 15% off with code: PIKWIZARD15


11
downloads
downloads
Tags:
More
Credit Photo
If you would like to credit the Photo, here are some ways you can do so
Text Link
photo Link
<span class="text-link">
<span>
<a target="_blank" href=https://pikwizard.com/photo/financial-analysis-chart-with-graph-document-and-calculator-on-desk/a45448a13a715bfb4990af5f4014f365/>PikWizard</a>
</span>
</span>
<span class="image-link">
<span
style="margin: 0 0 20px 0; display: inline-block; vertical-align: middle; width: 100%;"
>
<a
target="_blank"
href="https://pikwizard.com/photo/financial-analysis-chart-with-graph-document-and-calculator-on-desk/a45448a13a715bfb4990af5f4014f365/"
style="text-decoration: none; font-size: 10px; margin: 0;"
>
<img src="https://pikwizard.com/pw/medium/a45448a13a715bfb4990af5f4014f365.jpg" style="margin: 0; width: 100%;" alt="" />
<p style="font-size: 12px; margin: 0;">PikWizard</p>
</a>
</span>
</span>
Free (free of charge)
Free for personal and commercial use.
Author: People Creations
Similar Free Stock Images
Premium


Premium

Premium


Premium


Premium


Premium


Premium


Premium

Premium


Premium


Premium


Premium


Premium


Premium


Premium


Premium


Premium


Premium


Premium


Premium


Premium


Premium


Premium


Premium